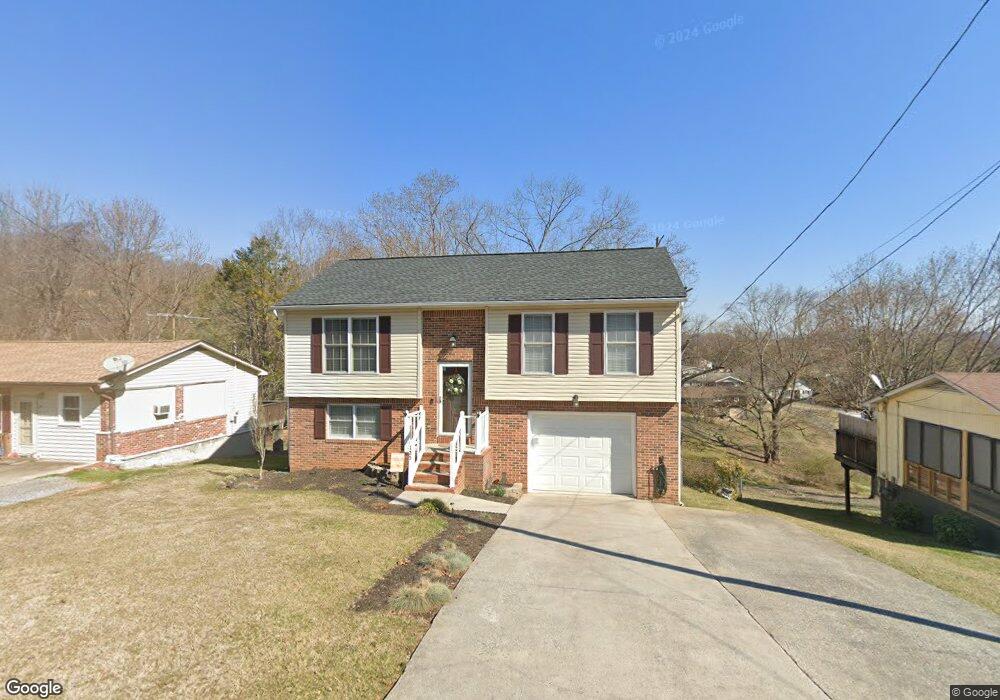
125 Lana View Dr Kingsport, TN 37664
Estimated Value: $182,000 - $301,000
--
Bed
2
Baths
1,295
Sq Ft
$175/Sq Ft
Est. Value
About This Home
This home is located at 125 Lana View Dr, Kingsport, TN 37664 and is currently estimated at $227,088, approximately $175 per square foot. 125 Lana View Dr is a home located in Sullivan County with nearby schools including Indian Springs Elementary School and Sullivan Central Middle School.
Ownership History
Date
Name
Owned For
Owner Type
Purchase Details
Closed on
May 1, 1998
Sold by
Meade Rebecca L
Bought by
Dean Taylor A and Dean Lourdes A
Current Estimated Value
Home Financials for this Owner
Home Financials are based on the most recent Mortgage that was taken out on this home.
Original Mortgage
$79,346
Outstanding Balance
$15,504
Interest Rate
7.1%
Estimated Equity
$211,584
Purchase Details
Closed on
Jul 3, 1996
Sold by
David Bailey
Bought by
Rebecca Meade
Home Financials for this Owner
Home Financials are based on the most recent Mortgage that was taken out on this home.
Original Mortgage
$77,700
Interest Rate
8.37%
Purchase Details
Closed on
Oct 18, 1995
Sold by
Phillip Horner
Bought by
David Bailey
Purchase Details
Closed on
Oct 17, 1995
Purchase Details
Closed on
Jun 12, 1995
Bought by
Salvatore Emanuele
Purchase Details
Closed on
Mar 8, 1995
Sold by
Robert Kraft
Bought by
Phillip Horner
Create a Home Valuation Report for This Property
The Home Valuation Report is an in-depth analysis detailing your home's value as well as a comparison with similar homes in the area
Home Values in the Area
Average Home Value in this Area
Purchase History
| Date | Buyer | Sale Price | Title Company |
|---|---|---|---|
| Dean Taylor A | $78,800 | -- | |
| Rebecca Meade | $75,000 | -- | |
| David Bailey | $70,810 | -- | |
| -- | $70,800 | -- | |
| Salvatore Emanuele | $48,000 | -- | |
| Phillip Horner | $6,000 | -- |
Source: Public Records
Mortgage History
| Date | Status | Borrower | Loan Amount |
|---|---|---|---|
| Open | Phillip Horner | $79,346 | |
| Previous Owner | Phillip Horner | $77,700 |
Source: Public Records
Tax History Compared to Growth
Tax History
| Year | Tax Paid | Tax Assessment Tax Assessment Total Assessment is a certain percentage of the fair market value that is determined by local assessors to be the total taxable value of land and additions on the property. | Land | Improvement |
|---|---|---|---|---|
| 2024 | $667 | $26,725 | $2,950 | $23,775 |
| 2023 | $643 | $26,725 | $2,950 | $23,775 |
| 2022 | $643 | $26,725 | $2,950 | $23,775 |
| 2021 | $643 | $26,725 | $2,950 | $23,775 |
| 2020 | $644 | $26,725 | $2,950 | $23,775 |
| 2019 | $644 | $25,050 | $2,950 | $22,100 |
| 2018 | $639 | $25,050 | $2,950 | $22,100 |
| 2017 | $639 | $25,050 | $2,950 | $22,100 |
| 2016 | $612 | $23,775 | $2,200 | $21,575 |
| 2014 | -- | $23,771 | $0 | $0 |
Source: Public Records
Map
Nearby Homes
- 4886 Eagle Pointe Dr
- 0 Foxfire Ln
- 192 Stage Rd
- Lot 3 Country Dr
- Lot 2 Country Dr
- Lot 21 Country Dr
- 321 Rockwood St
- 0 Orebank Rd Unit 307463
- 0 Orebank Rd Unit 11537999
- 5312 Foxfire Place
- 0 Moody Dr
- 5221 Foxfire Place
- 120 Lemay Dr
- 845 Emory Church Rd
- 105 Lemay Dr
- 5725 Chestnut Hills Dr
- 5705 Concord St
- 121 Southridge Dr
- 5028 Dublin Rd
- 128 Southridge Dr
- 129 Lana View Dr
- 121 Lana View Dr
- 137 Wembeck Dr
- 141 Wembeck Dr
- 133 Wembeck Dr
- 117 Lana View Dr
- 137 Lana View Dr
- 124 Lana View Dr
- 145 Wembeck Dr
- 116 Arley St
- Lot 8 Arley St
- 133 Lana View Dr
- 149 Wembeck Dr
- 113 Lana View Dr
- 157 Wembeck Dr
- 0 Wembeck Dr
- 109 Lana View Dr
- 112 Arley St
- 132 Wembeck Dr
- 134 Wembeck Dr