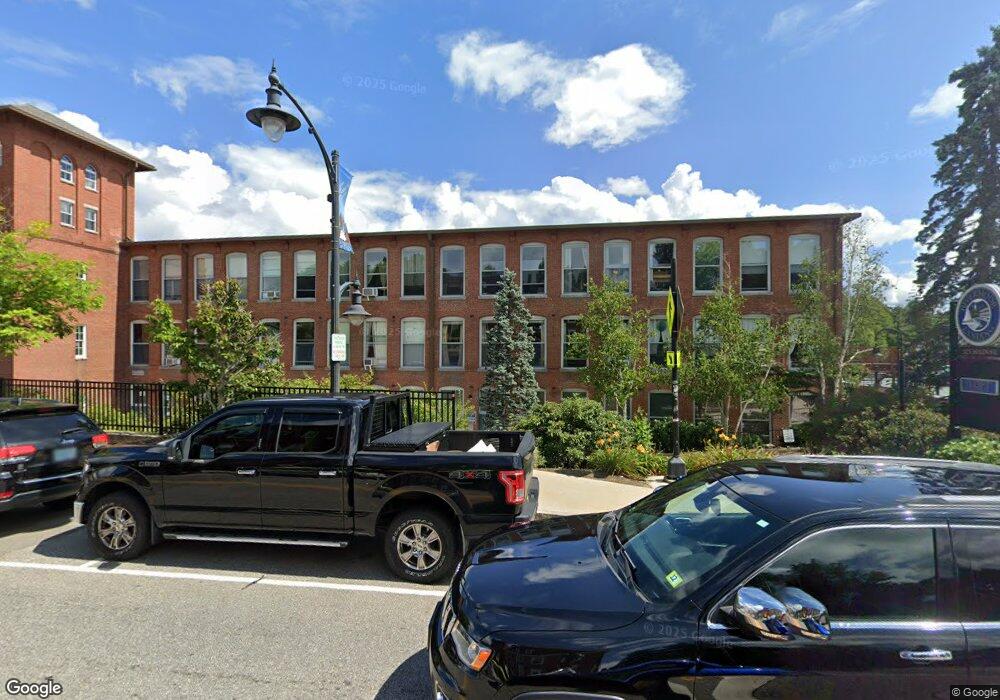
125 Main St Unit 16 Newmarket, NH 03857
Estimated Value: $362,000 - $452,000
1
Bed
1
Bath
917
Sq Ft
$449/Sq Ft
Est. Value
About This Home
This home is located at 125 Main St Unit 16, Newmarket, NH 03857 and is currently estimated at $411,705, approximately $448 per square foot. 125 Main St Unit 16 is a home located in Rockingham County with nearby schools including Newmarket Elementary School, Newmarket Junior High School, and Newmarket Senior High School.
Ownership History
Date
Name
Owned For
Owner Type
Purchase Details
Closed on
May 16, 2025
Sold by
Troxell Maerin D
Bought by
Ostien Joseph J
Current Estimated Value
Home Financials for this Owner
Home Financials are based on the most recent Mortgage that was taken out on this home.
Original Mortgage
$390,000
Outstanding Balance
$388,616
Interest Rate
6.64%
Mortgage Type
VA
Estimated Equity
$23,089
Purchase Details
Closed on
May 28, 2020
Sold by
Canniff Andrew C
Bought by
Troxell Martin
Home Financials for this Owner
Home Financials are based on the most recent Mortgage that was taken out on this home.
Original Mortgage
$260,865
Interest Rate
3.3%
Mortgage Type
VA
Purchase Details
Closed on
Dec 9, 2013
Sold by
Akrawi Layla
Bought by
Canniff Andrew C
Purchase Details
Closed on
Jun 30, 2000
Sold by
Bergamo John A and Bergamo Andrea M
Bought by
Akrawi Layla
Create a Home Valuation Report for This Property
The Home Valuation Report is an in-depth analysis detailing your home's value as well as a comparison with similar homes in the area
Home Values in the Area
Average Home Value in this Area
Purchase History
| Date | Buyer | Sale Price | Title Company |
|---|---|---|---|
| Ostien Joseph J | $390,000 | None Available | |
| Ostien Joseph J | $390,000 | None Available | |
| Troxell Martin | $255,000 | None Available | |
| Troxell Martin | $255,000 | None Available | |
| Canniff Andrew C | $139,900 | -- | |
| Canniff Andrew C | $139,900 | -- | |
| Akrawi Layla | $87,000 | -- | |
| Akrawi Layla | $87,000 | -- |
Source: Public Records
Mortgage History
| Date | Status | Borrower | Loan Amount |
|---|---|---|---|
| Open | Ostien Joseph J | $390,000 | |
| Closed | Ostien Joseph J | $390,000 | |
| Previous Owner | Troxell Martin | $260,865 | |
| Closed | Akrawi Layla | $0 |
Source: Public Records
Tax History Compared to Growth
Tax History
| Year | Tax Paid | Tax Assessment Tax Assessment Total Assessment is a certain percentage of the fair market value that is determined by local assessors to be the total taxable value of land and additions on the property. | Land | Improvement |
|---|---|---|---|---|
| 2024 | $6,577 | $382,400 | $0 | $382,400 |
| 2023 | $5,603 | $190,000 | $0 | $190,000 |
| 2022 | $5,128 | $190,000 | $0 | $190,000 |
| 2021 | $5,008 | $190,000 | $0 | $190,000 |
| 2020 | $4,837 | $190,000 | $0 | $190,000 |
| 2019 | $4,609 | $190,000 | $0 | $190,000 |
| 2018 | $3,760 | $128,600 | $0 | $128,600 |
| 2017 | $3,437 | $128,600 | $0 | $128,600 |
| 2016 | $3,291 | $129,300 | $0 | $129,300 |
| 2015 | $3,227 | $129,300 | $0 | $129,300 |
| 2014 | $3,329 | $129,300 | $0 | $129,300 |
| 2013 | $3,109 | $127,100 | $0 | $127,100 |
| 2012 | $3,008 | $127,100 | $0 | $127,100 |
Source: Public Records
Map
Nearby Homes
- 125 Main St Unit 39
- 125 Main St Unit 70
- 2 Chapel St
- 11 Creighton St
- 25 Nichols Ave
- 20 Amherst Rd
- 23 Columbia Dr
- 90 Colgate Rd
- 5 Bass St Unit A
- 73 Princeton St
- 5 River St
- 305 Piscassic St
- 1103 Piscassic St
- 26 Smith Garrison Rd
- D2 Wade Farm Rd
- 33 Folsom Dr
- 44 Gonet Dr
- 16 Bennett Way
- 17 Bennett Way
- 21 Briallia Cir
- 125 Main St Unit 14
- 125 Main St Unit 22
- 125 Main St
- 125 Main St Unit 25
- 125 Main St Unit 3
- 13 125 Main St Unit 13
- 23 125 Main Street Unit Unit 23
- 125 Main Street # 39 Unit 39
- 125 Main Street #33 Unit 33
- 112 Main St
- 55 Main St
- 23 125 Main Street Unit #23
- 106 Main St
- 102 Main St
- 90 Main St
- 98 Main St Unit 3
- 98 Main St Unit 2
- 98 Main St
- 88 Main St
- 96 Main St Unit B