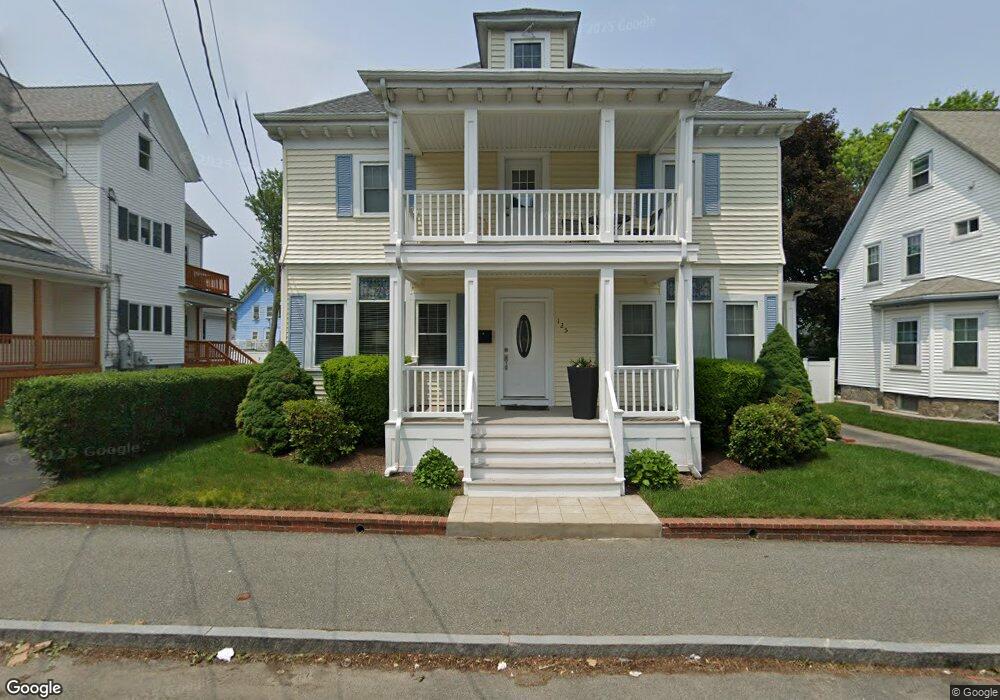
125 Menlo St Brockton, MA 02301
Clifton Heights NeighborhoodEstimated Value: $486,000 - $668,000
4
Beds
2
Baths
2,040
Sq Ft
$274/Sq Ft
Est. Value
About This Home
This home is located at 125 Menlo St, Brockton, MA 02301 and is currently estimated at $559,643, approximately $274 per square foot. 125 Menlo St is a home located in Plymouth County with nearby schools including Gilmore Elementary School, John F. Kennedy Elementary School, and Davis K-8 School.
Ownership History
Date
Name
Owned For
Owner Type
Purchase Details
Closed on
Mar 23, 2009
Sold by
Fontes Luis A and Lopes Adelina R
Bought by
Fontes Adelina L and Fontes Luis A
Current Estimated Value
Home Financials for this Owner
Home Financials are based on the most recent Mortgage that was taken out on this home.
Original Mortgage
$112,500
Outstanding Balance
$71,989
Interest Rate
5.25%
Mortgage Type
Purchase Money Mortgage
Estimated Equity
$487,654
Purchase Details
Closed on
May 1, 1996
Sold by
Solari Norrine M
Bought by
Fontes Luis A and Lopes Adelina R
Purchase Details
Closed on
Nov 30, 1987
Sold by
Price Robert J
Bought by
Solari Norrine M
Create a Home Valuation Report for This Property
The Home Valuation Report is an in-depth analysis detailing your home's value as well as a comparison with similar homes in the area
Home Values in the Area
Average Home Value in this Area
Purchase History
| Date | Buyer | Sale Price | Title Company |
|---|---|---|---|
| Fontes Adelina L | -- | -- | |
| Fontes Luis A | $107,500 | -- | |
| Solari Norrine M | $142,500 | -- |
Source: Public Records
Mortgage History
| Date | Status | Borrower | Loan Amount |
|---|---|---|---|
| Closed | Solari Norrine M | $20,000 | |
| Open | Solari Norrine M | $112,500 | |
| Previous Owner | Solari Norrine M | $35,000 |
Source: Public Records
Tax History
| Year | Tax Paid | Tax Assessment Tax Assessment Total Assessment is a certain percentage of the fair market value that is determined by local assessors to be the total taxable value of land and additions on the property. | Land | Improvement |
|---|---|---|---|---|
| 2025 | $5,399 | $445,800 | $137,600 | $308,200 |
| 2024 | $5,147 | $428,200 | $137,600 | $290,600 |
| 2023 | $5,147 | $396,500 | $102,700 | $293,800 |
| 2022 | $4,903 | $351,000 | $93,200 | $257,800 |
| 2021 | $4,918 | $339,200 | $77,100 | $262,100 |
| 2020 | $4,571 | $301,700 | $72,600 | $229,100 |
| 2019 | $4,451 | $286,400 | $70,400 | $216,000 |
| 2018 | $4,229 | $263,300 | $70,400 | $192,900 |
| 2017 | $4,004 | $248,700 | $70,400 | $178,300 |
| 2016 | $3,751 | $216,100 | $68,200 | $147,900 |
| 2015 | $3,839 | $211,500 | $68,200 | $143,300 |
| 2014 | $3,825 | $211,000 | $68,200 | $142,800 |
Source: Public Records
Map
Nearby Homes
Your Personal Tour Guide
Ask me questions while you tour the home.