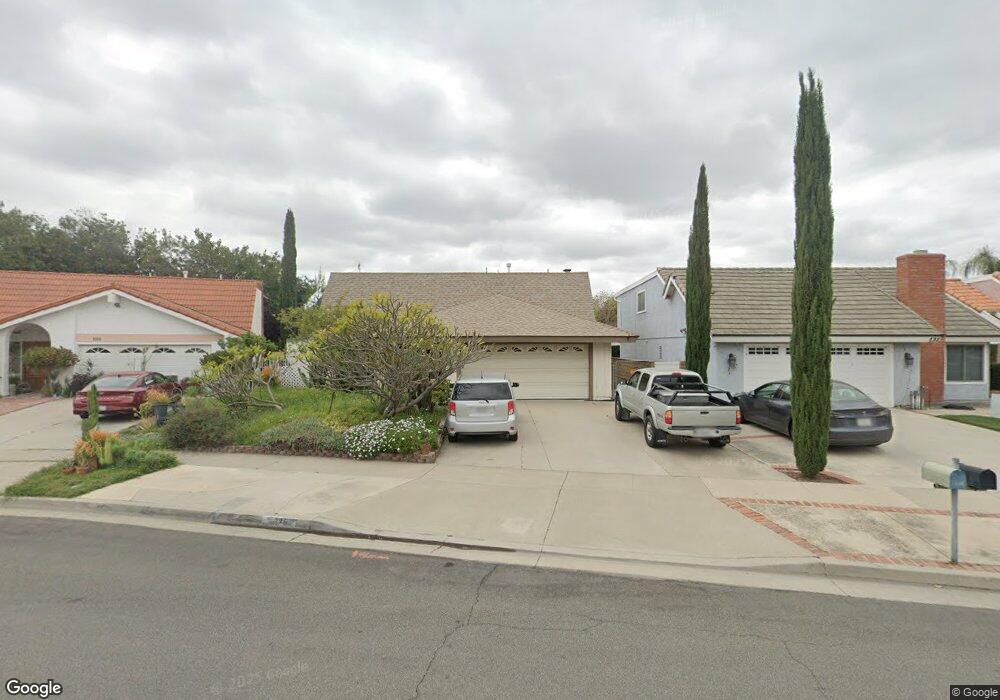
125 N Avenida Cienega Anaheim, CA 92807
Anaheim Hills NeighborhoodEstimated Value: $1,069,000 - $1,135,000
3
Beds
3
Baths
1,574
Sq Ft
$692/Sq Ft
Est. Value
About This Home
This home is located at 125 N Avenida Cienega, Anaheim, CA 92807 and is currently estimated at $1,089,088, approximately $691 per square foot. 125 N Avenida Cienega is a home located in Orange County with nearby schools including Crescent Elementary School, Canyon High School, and El Rancho Charter.
Ownership History
Date
Name
Owned For
Owner Type
Purchase Details
Closed on
Jul 30, 2024
Sold by
Sarange Cyrus and Sarange Azadeh
Bought by
Sarange Revocable Living Trust and Sarange
Current Estimated Value
Purchase Details
Closed on
Apr 3, 2009
Sold by
Sarange Cyrus
Bought by
Sarange Cyrus and Sarange Azadeh
Home Financials for this Owner
Home Financials are based on the most recent Mortgage that was taken out on this home.
Original Mortgage
$338,500
Interest Rate
5.06%
Mortgage Type
New Conventional
Purchase Details
Closed on
Oct 8, 2003
Sold by
Miller Patrick D and Miller Nancy Lynn
Bought by
Sarange Cyrus
Home Financials for this Owner
Home Financials are based on the most recent Mortgage that was taken out on this home.
Original Mortgage
$350,000
Interest Rate
5.25%
Mortgage Type
Purchase Money Mortgage
Purchase Details
Closed on
Dec 26, 1995
Sold by
Miller Nancy Lynn and Walsh Nancy Lynn
Bought by
Miller Patrick D and Miller Nancy Lynn
Purchase Details
Closed on
Oct 25, 1995
Sold by
Walsh James Leslie
Bought by
Walsh Nancy Lynn
Create a Home Valuation Report for This Property
The Home Valuation Report is an in-depth analysis detailing your home's value as well as a comparison with similar homes in the area
Home Values in the Area
Average Home Value in this Area
Purchase History
| Date | Buyer | Sale Price | Title Company |
|---|---|---|---|
| Sarange Revocable Living Trust | -- | None Listed On Document | |
| Sarange Cyrus | -- | None Available | |
| Sarange Cyrus | -- | First American Title Ins Co | |
| Sarange Cyrus | $447,000 | First American Title Co | |
| Miller Patrick D | -- | North American Title Co | |
| Walsh Nancy Lynn | -- | -- |
Source: Public Records
Mortgage History
| Date | Status | Borrower | Loan Amount |
|---|---|---|---|
| Previous Owner | Sarange Cyrus | $338,500 | |
| Previous Owner | Sarange Cyrus | $350,000 |
Source: Public Records
Tax History Compared to Growth
Tax History
| Year | Tax Paid | Tax Assessment Tax Assessment Total Assessment is a certain percentage of the fair market value that is determined by local assessors to be the total taxable value of land and additions on the property. | Land | Improvement |
|---|---|---|---|---|
| 2025 | $6,905 | $635,535 | $495,506 | $140,029 |
| 2024 | $6,905 | $623,074 | $485,790 | $137,284 |
| 2023 | $6,751 | $610,857 | $476,264 | $134,593 |
| 2022 | $6,619 | $598,880 | $466,926 | $131,954 |
| 2021 | $6,433 | $587,138 | $457,771 | $129,367 |
| 2020 | $6,373 | $581,118 | $453,077 | $128,041 |
| 2019 | $6,291 | $569,724 | $444,193 | $125,531 |
| 2018 | $6,194 | $558,553 | $435,483 | $123,070 |
| 2017 | $5,936 | $547,601 | $426,944 | $120,657 |
| 2016 | $5,820 | $536,864 | $418,572 | $118,292 |
| 2015 | $5,744 | $528,800 | $412,284 | $116,516 |
| 2014 | $5,621 | $518,442 | $404,208 | $114,234 |
Source: Public Records
Map
Nearby Homes
- 242 N Camino Arroyo
- 6189 E Camino Manzano
- 157 S Donna Ct
- 7350 E Calle Durango
- 131 S Francisco St
- 5815 E La Palma Ave Unit 74
- 5815 E La Palma Ave Unit 190
- 5815 E La Palma Ave Unit 133
- 6821 Rocky Grove Ct Unit 13
- 397 S San Vicente Ln Unit 31
- 5901 E Firenze Crescent
- 6473 Horse Shoe Ln Unit 6
- 6478 Horse Shoe Ln Unit 9
- 20002 Wrightwood Ct Unit 31
- 6437 Horse Shoe Ln Unit 2
- 20180 Pingree Way
- 1290 N Tippetts Ln
- 20453 Elm Hill Ln Unit 26
- 20267 Clear River Ln Unit 7
- 6587 E Via Arboles
- 131 N Avenida Cienega
- 119 N Avenida Cienega
- 6171 E Paseo Rio Verde
- 111 N Avenida Cienega
- 6167 E Paseo Rio Verde
- 6168 E Paseo Rio Verde
- 6179 E Paseo Rio Verde
- 143 N Avenida Cienega
- 105 N Avenida Cienega
- 134 N Paseo Rio Moreno
- 6163 E Paseo Rio Verde
- 6176 E Paseo Rio Verde
- 6166 E Camino Correr
- 6164 E Paseo Rio Verde
- 149 N Avenida Cienega
- 142 N Paseo Rio Moreno
- 6180 E Paseo Rio Verde
- 6174 E Camino Correr
- 6160 E Paseo Rio Verde
- 6153 E Paseo Rio Verde