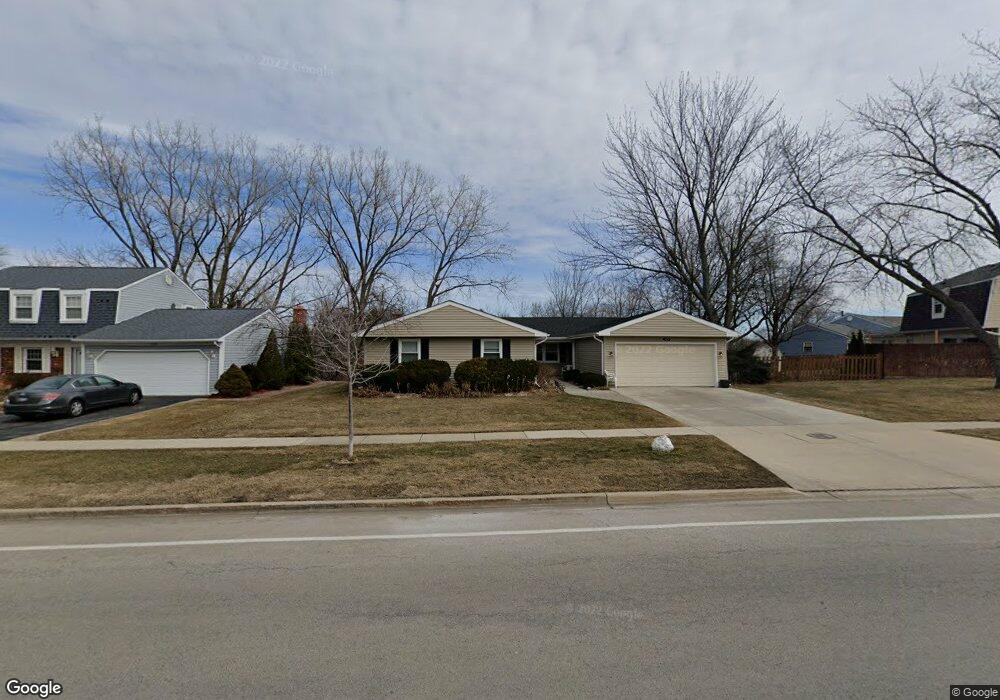
125 N Braintree Dr Unit 10 Schaumburg, IL 60194
Hoover Park NeighborhoodEstimated Value: $427,000 - $478,000
4
Beds
2
Baths
1,978
Sq Ft
$228/Sq Ft
Est. Value
About This Home
This home is located at 125 N Braintree Dr Unit 10, Schaumburg, IL 60194 and is currently estimated at $450,237, approximately $227 per square foot. 125 N Braintree Dr Unit 10 is a home located in Cook County with nearby schools including Hoover Math And Science Academy, Helen Keller Junior High School, and Schaumburg High School.
Ownership History
Date
Name
Owned For
Owner Type
Purchase Details
Closed on
Nov 10, 2023
Sold by
Benjamin B And Gerarda Barticke Trust
Bought by
Sheila M Bartnicke Special Needs Trust and Bruhn
Current Estimated Value
Purchase Details
Closed on
Dec 30, 2019
Sold by
Bartnicke Gerarda J
Bought by
Bartnicke Gerarda J and Bartnicke Benjamin B
Purchase Details
Closed on
Oct 13, 1995
Sold by
Darras Chris W and Darras Jean M
Bought by
Bartnicke Benjamin B and Bartnicke Gerarda J
Home Financials for this Owner
Home Financials are based on the most recent Mortgage that was taken out on this home.
Original Mortgage
$136,500
Interest Rate
7.7%
Purchase Details
Closed on
Oct 29, 1993
Sold by
Luprich Joseph F and Luprich Mary C
Bought by
Darras Chris W and Darras Jean M
Home Financials for this Owner
Home Financials are based on the most recent Mortgage that was taken out on this home.
Original Mortgage
$149,710
Interest Rate
7%
Mortgage Type
FHA
Create a Home Valuation Report for This Property
The Home Valuation Report is an in-depth analysis detailing your home's value as well as a comparison with similar homes in the area
Home Values in the Area
Average Home Value in this Area
Purchase History
| Date | Buyer | Sale Price | Title Company |
|---|---|---|---|
| Sheila M Bartnicke Special Needs Trust | -- | None Listed On Document | |
| Bartnicke Gerarda J | -- | Attorney | |
| Bartnicke Benjamin B | $172,500 | Attorneys Natl Title Network | |
| Darras Chris W | $102,666 | -- |
Source: Public Records
Mortgage History
| Date | Status | Borrower | Loan Amount |
|---|---|---|---|
| Previous Owner | Bartnicke Benjamin B | $136,500 | |
| Previous Owner | Darras Chris W | $149,710 |
Source: Public Records
Tax History Compared to Growth
Tax History
| Year | Tax Paid | Tax Assessment Tax Assessment Total Assessment is a certain percentage of the fair market value that is determined by local assessors to be the total taxable value of land and additions on the property. | Land | Improvement |
|---|---|---|---|---|
| 2024 | $7,572 | $33,000 | $6,855 | $26,145 |
| 2023 | $7,291 | $33,000 | $6,855 | $26,145 |
| 2022 | $7,291 | $33,000 | $6,855 | $26,145 |
| 2021 | $5,600 | $24,472 | $4,651 | $19,821 |
| 2020 | $5,626 | $24,472 | $4,651 | $19,821 |
| 2019 | $5,716 | $27,497 | $4,651 | $22,846 |
| 2018 | $5,345 | $23,995 | $4,162 | $19,833 |
| 2017 | $5,293 | $23,995 | $4,162 | $19,833 |
| 2016 | $6,021 | $26,080 | $4,162 | $21,918 |
| 2015 | $4,351 | $19,039 | $3,672 | $15,367 |
| 2014 | $4,331 | $19,039 | $3,672 | $15,367 |
| 2013 | $4,510 | $20,149 | $3,672 | $16,477 |
Source: Public Records
Map
Nearby Homes
- 104 N Braintree Dr
- 1123 Stoughton Ct Unit 1664
- 1314 Colwyn Dr
- 100 Ellington Dr
- 1425 Colwyn Dr
- 1125 Charlene Ln
- 1321 Yarmouth Ct Unit 662
- 501 Argyll Ln
- 225 Barcliffe Ln Unit 1011
- 640 Downey St
- 20 Emerson Dr
- 100 Westover Ln
- 124 Westover Ln
- 908 Jeffery Ct
- 700 N Hundley St
- 604 N Brookdale Dr
- 365 Washington Blvd
- 320 Pleasant St
- 305 Williams Dr
- 220 Kemah Ln
- 129 N Braintree Dr
- 121 N Braintree Dr
- 119 N Braintree Dr
- 133 N Braintree Dr
- 126 N Braintree Dr
- 120 N Braintree Dr
- 117 N Braintree Dr
- 114 N Braintree Dr
- 132 N Braintree Dr
- 207 N Braintree Dr
- 115 N Braintree Dr
- 111 N Braintree Dr
- 110 N Braintree Dr
- 113 Amboy Ln
- 115 Amboy Ln
- 204 Wickham Dr
- 1232 Elm Dr
- 113 N Braintree Dr
- 200 N Braintree Dr Unit 8
- 109 Amboy Ln