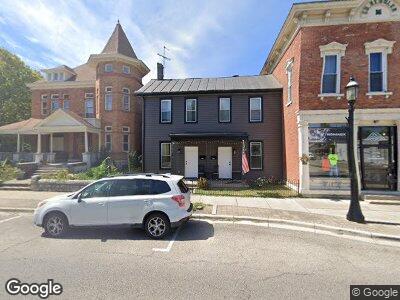
125 N Main St Miamisburg, OH 45342
Downtown Miamisburg NeighborhoodEstimated Value: $124,033 - $164,000
3
Beds
2
Baths
1,812
Sq Ft
$79/Sq Ft
Est. Value
About This Home
This home is located at 125 N Main St, Miamisburg, OH 45342 and is currently estimated at $143,508, approximately $79 per square foot. 125 N Main St is a home located in Montgomery County with nearby schools including Miamisburg High School and Bethel Baptist School.
Ownership History
Date
Name
Owned For
Owner Type
Purchase Details
Closed on
Dec 15, 2021
Sold by
Mastbaum Patricia A
Bought by
Patricia A Mastbaum Revocable Trust and Hutton
Current Estimated Value
Home Financials for this Owner
Home Financials are based on the most recent Mortgage that was taken out on this home.
Original Mortgage
$176,250
Outstanding Balance
$165,031
Interest Rate
3.09%
Mortgage Type
Future Advance Clause Open End Mortgage
Estimated Equity
-$23,097
Purchase Details
Closed on
Dec 1, 2021
Sold by
Hutton Eugenia and Patricia A Mastbaum Revocable
Bought by
Drw Property Development Llc
Home Financials for this Owner
Home Financials are based on the most recent Mortgage that was taken out on this home.
Original Mortgage
$176,250
Outstanding Balance
$165,031
Interest Rate
3.09%
Mortgage Type
Future Advance Clause Open End Mortgage
Estimated Equity
-$23,097
Purchase Details
Closed on
Jul 13, 2012
Sold by
Mastbaum Joseph H
Bought by
Mastbaum Joseph H
Create a Home Valuation Report for This Property
The Home Valuation Report is an in-depth analysis detailing your home's value as well as a comparison with similar homes in the area
Home Values in the Area
Average Home Value in this Area
Purchase History
| Date | Buyer | Sale Price | Title Company |
|---|---|---|---|
| Patricia A Mastbaum Revocable Trust | -- | -- | |
| Joseph H Mastbaum Revocable Trust | -- | -- | |
| Drw Property Development Llc | $135,000 | First American Title | |
| Mastbaum Joseph H | -- | None Available | |
| Mastbaum Patricia A | -- | None Available |
Source: Public Records
Mortgage History
| Date | Status | Borrower | Loan Amount |
|---|---|---|---|
| Open | Drw Property Development Llc | $176,250 | |
| Previous Owner | Mastbaum Joseph H | $190,000 |
Source: Public Records
Tax History Compared to Growth
Tax History
| Year | Tax Paid | Tax Assessment Tax Assessment Total Assessment is a certain percentage of the fair market value that is determined by local assessors to be the total taxable value of land and additions on the property. | Land | Improvement |
|---|---|---|---|---|
| 2024 | $1,421 | $20,020 | $4,990 | $15,030 |
| 2023 | $1,421 | $20,020 | $4,990 | $15,030 |
| 2022 | $1,263 | $14,830 | $3,700 | $11,130 |
| 2021 | $1,135 | $14,830 | $3,700 | $11,130 |
| 2020 | $1,132 | $14,830 | $3,700 | $11,130 |
| 2019 | $1,061 | $12,640 | $3,360 | $9,280 |
| 2018 | $1,064 | $12,640 | $3,360 | $9,280 |
| 2017 | $1,058 | $12,640 | $3,360 | $9,280 |
| 2016 | $1,094 | $12,640 | $3,360 | $9,280 |
| 2015 | $1,075 | $12,640 | $3,360 | $9,280 |
| 2014 | $1,075 | $12,640 | $3,360 | $9,280 |
| 2012 | -- | $12,620 | $3,360 | $9,260 |
Source: Public Records
Map
Nearby Homes
- 105 S 2nd St
- 434 Buckeye St
- 7 N Riverview Ave
- 532 E Pearl St
- 543 Buckeye St
- 615 E Pearl St
- 714 E Pearl St
- 224 Suttman St
- 20 S 7th St
- 12 Center St
- 434 S 2nd St Unit 432
- 740 E Central Ave
- 819 E Maple Ave
- 306 S 7th St
- 631 Upper Miamisburg Rd
- 281 S Riverview Ave
- 125 N 10th St
- 20 N 10th St
- 1225 N 8th St
- 111 Overland Trail