Estimated Value: $92,680 - $275,000
--
Bed
--
Bath
440
Sq Ft
$453/Sq Ft
Est. Value
About This Home
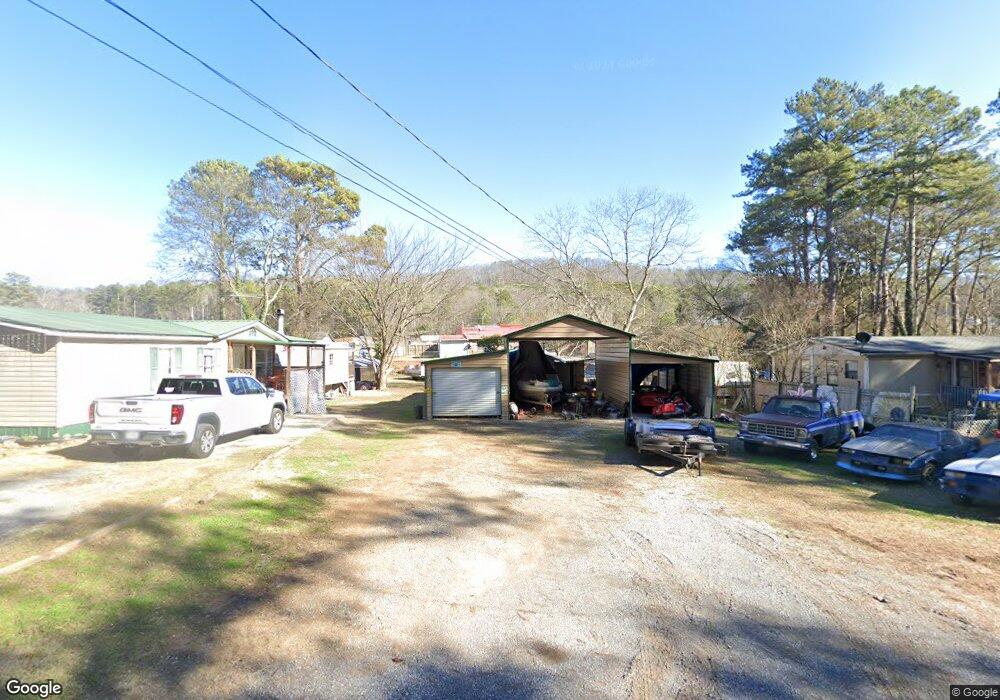
This home is located at 125 Nancy St SE, Rome, GA 30161 and is currently estimated at $199,420, approximately $453 per square foot. 125 Nancy St SE is a home located in Floyd County with nearby schools including Pepperell Middle School, Pepperell High School, and Montessori School of Rome.
Ownership History
Date
Name
Owned For
Owner Type
Purchase Details
Closed on
Nov 3, 2015
Sold by
Jones David Wayne
Bought by
Wigley William Wallace
Current Estimated Value
Purchase Details
Closed on
Aug 22, 2008
Sold by
Wigley Maureen
Bought by
Jones David W
Purchase Details
Closed on
Jun 10, 2008
Sold by
Not Provided
Bought by
Wigley Maureen
Purchase Details
Closed on
Dec 9, 1993
Sold by
Johnson William A
Bought by
Plemons Maureen
Purchase Details
Closed on
May 6, 1993
Sold by
Plemmons Maureen
Bought by
Johnson William A
Purchase Details
Closed on
Jun 26, 1992
Sold by
Wigley Hazel S
Bought by
Plemmons Maureen
Purchase Details
Closed on
Mar 6, 1992
Sold by
Plemmons Maureen
Bought by
Wigley Hazel S
Purchase Details
Closed on
Jan 1, 1992
Sold by
Plemmons Maureen and Plemmons Barry
Bought by
Plemmons Maureen
Purchase Details
Closed on
May 3, 1991
Bought by
Plemmons Maureen and Plemmons Barry
Create a Home Valuation Report for This Property
The Home Valuation Report is an in-depth analysis detailing your home's value as well as a comparison with similar homes in the area
Home Values in the Area
Average Home Value in this Area
Purchase History
| Date | Buyer | Sale Price | Title Company |
|---|---|---|---|
| Wigley William Wallace | -- | -- | |
| Jones David W | $10,000 | -- | |
| Wigley Maureen | -- | -- | |
| Wigley Maureen | -- | -- | |
| Plemons Maureen | $3,100 | -- | |
| Johnson William A | $1,000 | -- | |
| Plemmons Maureen | -- | -- | |
| Wigley Hazel S | -- | -- | |
| Plemmons Maureen | -- | -- | |
| Plemmons Maureen | -- | -- |
Source: Public Records
Tax History Compared to Growth
Tax History
| Year | Tax Paid | Tax Assessment Tax Assessment Total Assessment is a certain percentage of the fair market value that is determined by local assessors to be the total taxable value of land and additions on the property. | Land | Improvement |
|---|---|---|---|---|
| 2024 | $504 | $15,957 | $4,312 | $11,645 |
| 2023 | $457 | $15,230 | $3,920 | $11,310 |
| 2022 | $331 | $11,148 | $3,214 | $7,934 |
| 2021 | $255 | $8,437 | $2,926 | $5,511 |
| 2020 | $236 | $7,751 | $2,544 | $5,207 |
| 2019 | $228 | $7,594 | $2,544 | $5,050 |
| 2018 | $216 | $7,194 | $2,423 | $4,771 |
| 2017 | $210 | $6,956 | $2,243 | $4,713 |
| 2016 | $211 | $6,915 | $2,240 | $4,675 |
| 2015 | $206 | $6,915 | $2,240 | $4,675 |
| 2014 | $206 | $6,915 | $2,240 | $4,675 |
Source: Public Records
Map
Nearby Homes
- 519 Dr SE
- 52 Twickenham Rd SE
- 33 Summit Dr
- 333 Alfred Ave SE
- 0 Wellington Way SE Unit 7374604
- 0 Wellington Way SE Unit 7374602
- 0 Wellington Way SE Unit 20180069
- 0 Wellington Way SE Unit 20180068
- 16 Summit Dr SE
- 409 Flora Ave SE
- 327 Flora Ave SE
- 3014 Maple Rd SE
- 3010 Maple Rd SE
- 13 Spring Cir SE
- 85 Cambridge Dr SE
- 3 Belmont Ct SE
- 15 Saddlebrook Dr SE
- 211 Chateau Dr SE
- 11 Cambridge Dr SE
- 2812 Maple Rd SE
- 123 Nancy St SE
- 127 Nancy St SE
- 121 Nancy St SE
- 85 Nancy St SE
- 3118 Rockmart Rd SE
- 71 Nancy St SE
- 82 Nancy St SE
- 3125 Rockmart Rd SE
- 3125 Rockmart Rd SE
- 58 Nancy St SE
- 0 Rockmart Hwy N Unit 10144403
- 3127 Rockmart Rd SE
- 122 Nancy St SE
- 3007 Rockmart Rd SE
- 36 Nancy St SE
- 36 Nancy St SE
- 3113 Rockmart Rd SE
- 18 Mccord Dr SE
- 18 Mccord Dr SE
- 18 Mccord Dr SE