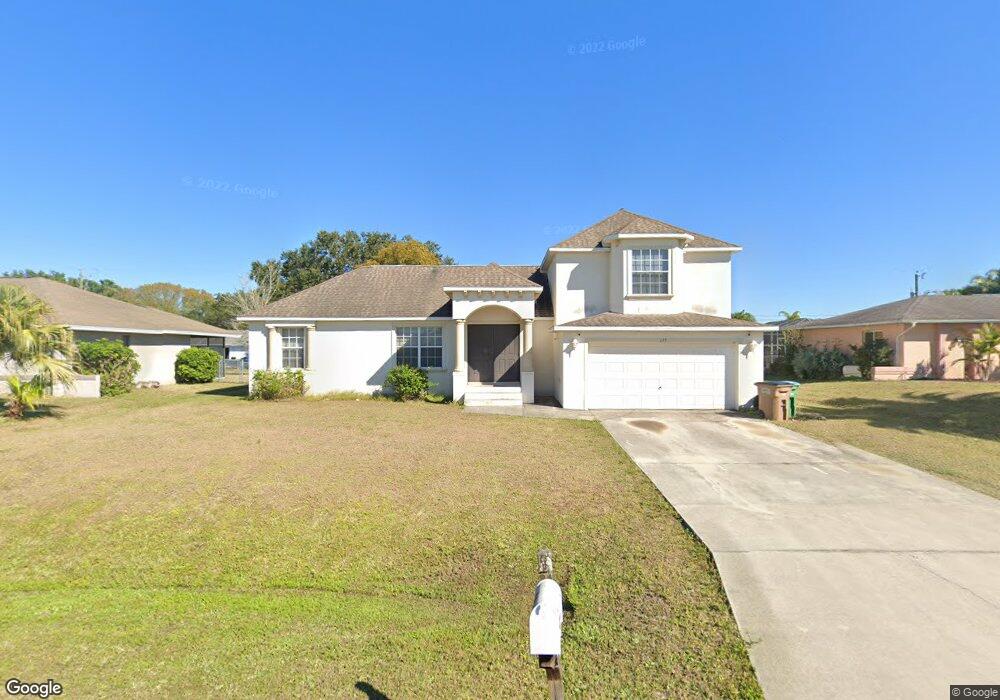
125 NE 9th Ct Cape Coral, FL 33909
Hancock NeighborhoodEstimated Value: $281,545 - $327,000
3
Beds
2
Baths
2,126
Sq Ft
$146/Sq Ft
Est. Value
About This Home
This home is located at 125 NE 9th Ct, Cape Coral, FL 33909 and is currently estimated at $309,386, approximately $145 per square foot. 125 NE 9th Ct is a home located in Lee County with nearby schools including Caloosa Elementary School, Hancock Creek Elementary School, and Tropic Isles Elementary School.
Ownership History
Date
Name
Owned For
Owner Type
Purchase Details
Closed on
Jun 18, 2010
Sold by
Pacheco Michael J and Pacheco Donna M
Bought by
Corona Property Holdings Llc
Current Estimated Value
Purchase Details
Closed on
Aug 28, 2009
Sold by
Domico Properties Llc
Bought by
Pacheco Michael J and Pacheco Donna M
Purchase Details
Closed on
Aug 8, 2007
Sold by
Pacheco Michael J and Pacheco Donna M
Bought by
Domico Properties Llc
Purchase Details
Closed on
Dec 5, 2005
Sold by
Better Homes Of Southwest Florida Inc
Bought by
Pacheco Michael J and Pacheco Donna M
Purchase Details
Closed on
Nov 4, 2003
Sold by
Hagen Connie
Bought by
Better Homes Sw Fl Inc
Home Financials for this Owner
Home Financials are based on the most recent Mortgage that was taken out on this home.
Original Mortgage
$28,800
Interest Rate
5.93%
Purchase Details
Closed on
Jan 16, 2001
Sold by
Skar Brian W and Laursen Tammy
Bought by
Hagen Connie
Create a Home Valuation Report for This Property
The Home Valuation Report is an in-depth analysis detailing your home's value as well as a comparison with similar homes in the area
Home Values in the Area
Average Home Value in this Area
Purchase History
| Date | Buyer | Sale Price | Title Company |
|---|---|---|---|
| Corona Property Holdings Llc | $95,000 | Security Title & Abstract Ll | |
| Pacheco Michael J | -- | Attorney | |
| Domico Properties Llc | $325,000 | Attorney | |
| Pacheco Michael J | $104,000 | Executive Title Ins Services | |
| Better Homes Sw Fl Inc | $24,000 | -- | |
| Hagen Connie | -- | -- |
Source: Public Records
Mortgage History
| Date | Status | Borrower | Loan Amount |
|---|---|---|---|
| Previous Owner | Better Homes Sw Fl Inc | $28,800 |
Source: Public Records
Tax History Compared to Growth
Tax History
| Year | Tax Paid | Tax Assessment Tax Assessment Total Assessment is a certain percentage of the fair market value that is determined by local assessors to be the total taxable value of land and additions on the property. | Land | Improvement |
|---|---|---|---|---|
| 2025 | $4,650 | $261,416 | -- | -- |
| 2024 | $4,676 | $237,651 | -- | -- |
| 2023 | $4,676 | $216,046 | $0 | $0 |
| 2022 | $4,062 | $196,405 | $0 | $0 |
| 2021 | $3,677 | $179,092 | $27,000 | $152,092 |
| 2020 | $3,493 | $162,318 | $22,000 | $140,318 |
| 2019 | $3,406 | $159,880 | $24,000 | $135,880 |
| 2018 | $3,228 | $151,001 | $24,000 | $127,001 |
| 2017 | $3,091 | $150,203 | $13,000 | $137,203 |
| 2016 | $2,843 | $132,619 | $13,000 | $119,619 |
| 2015 | $2,635 | $117,704 | $13,000 | $104,704 |
| 2014 | -- | $111,597 | $9,024 | $102,573 |
| 2013 | -- | $89,499 | $4,600 | $84,899 |
Source: Public Records
Map
Nearby Homes
- 118 NE 9th Ct
- 205 NE 9th Ct
- 210 NE 10th Ave
- 3445 NE 9th Place
- 218 NE 9th Place Unit 55
- 205 NE 9th Place
- 225 NE 10th Place
- 31 NE 10th Ave
- 1033 NE 2nd St
- 114 NE 8th Place
- 1121 van Loon Commons Cir Unit 304
- 1045 NE 2nd St
- 834 NE van Loon Ln
- 925 NE Pine Island Ln
- 230 NE 9th Ave
- 1105 van Loon Commons Cir Unit 303
- 1105 van Loon Commons Cir Unit 301
- 1029 NE van Loon Ln
- 125 Cultural Park Blvd N
- 1010 NE 3rd St
- 121 NE 9th Ct
- 129 NE 9th Ct
- 124 NE 10th Ave
- 128 NE 10th Ave
- 133 NE 9th Ct
- 117 NE 9th Ct
- 120 NE 10th Ave
- 132 NE 10th Ave
- 126 NE 9th Ct
- 122 NE 9th Ct
- 130 NE 9th Ct
- 202 NE 10th Ave
- 201 NE 9th Ct
- 113 NE 9th Ct
- 114 NE 9th Ct
- 121 NE 9th Place
- 206 NE 10th Ave
- 112 NE 10th Ave
- 125 NE 10th Ave
- 129 NE 10th Ave