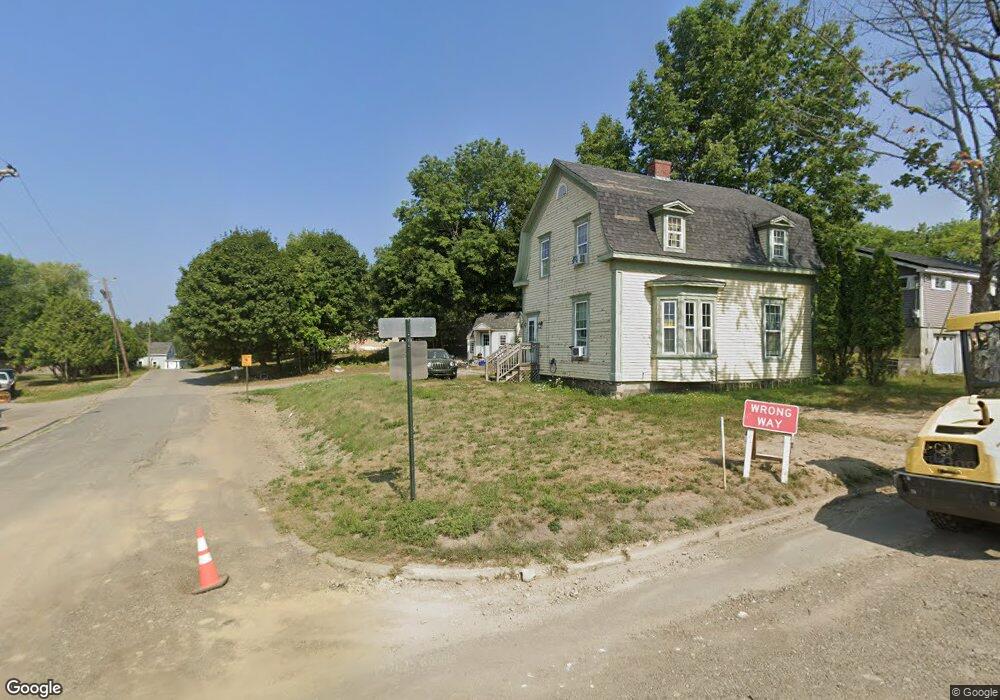
125 North St Calais, ME 04619
Estimated Value: $91,000 - $169,000
2
Beds
2
Baths
500
Sq Ft
$276/Sq Ft
Est. Value
About This Home
This home is located at 125 North St, Calais, ME 04619 and is currently estimated at $137,950, approximately $275 per square foot. 125 North St is a home with nearby schools including Calais Elementary School and Calais Middle/High School.
Ownership History
Date
Name
Owned For
Owner Type
Purchase Details
Closed on
Jan 14, 2022
Sold by
Fairbrother Eva R Est and Kinney
Bought by
Kinney Christopher D and Cummings Tamra
Current Estimated Value
Home Financials for this Owner
Home Financials are based on the most recent Mortgage that was taken out on this home.
Original Mortgage
$52,000
Outstanding Balance
$47,689
Interest Rate
3.05%
Mortgage Type
Purchase Money Mortgage
Estimated Equity
$90,261
Purchase Details
Closed on
Feb 7, 2014
Sold by
Farrar Harold Est and Farrar
Bought by
Fairbrother Eva R
Create a Home Valuation Report for This Property
The Home Valuation Report is an in-depth analysis detailing your home's value as well as a comparison with similar homes in the area
Home Values in the Area
Average Home Value in this Area
Purchase History
| Date | Buyer | Sale Price | Title Company |
|---|---|---|---|
| Kinney Christopher D | $65,000 | None Available | |
| Fairbrother Eva R | -- | -- | |
| Fairbrother Eva R | -- | -- |
Source: Public Records
Mortgage History
| Date | Status | Borrower | Loan Amount |
|---|---|---|---|
| Open | Kinney Christopher D | $52,000 |
Source: Public Records
Tax History Compared to Growth
Tax History
| Year | Tax Paid | Tax Assessment Tax Assessment Total Assessment is a certain percentage of the fair market value that is determined by local assessors to be the total taxable value of land and additions on the property. | Land | Improvement |
|---|---|---|---|---|
| 2024 | $1,911 | $127,400 | $27,200 | $100,200 |
| 2023 | $1,870 | $110,000 | $23,500 | $86,500 |
| 2022 | $1,689 | $88,900 | $19,000 | $69,900 |
| 2021 | $1,840 | $85,200 | $18,200 | $67,000 |
| 2020 | $1,844 | $72,900 | $15,600 | $57,300 |
| 2019 | $1,844 | $72,900 | $15,600 | $57,300 |
| 2018 | $1,844 | $72,900 | $15,600 | $57,300 |
| 2017 | $1,844 | $72,900 | $15,600 | $57,300 |
| 2016 | $1,844 | $72,900 | $15,600 | $57,300 |
| 2015 | $1,844 | $72,900 | $15,600 | $57,300 |
| 2014 | $1,844 | $72,900 | $15,600 | $57,300 |
| 2013 | $1,844 | $72,900 | $15,600 | $57,300 |
Source: Public Records
Map
Nearby Homes