
Seller's Agent in 2025
Leslie Davis
Living Down South Realty
1 in this area
9 Total Sales
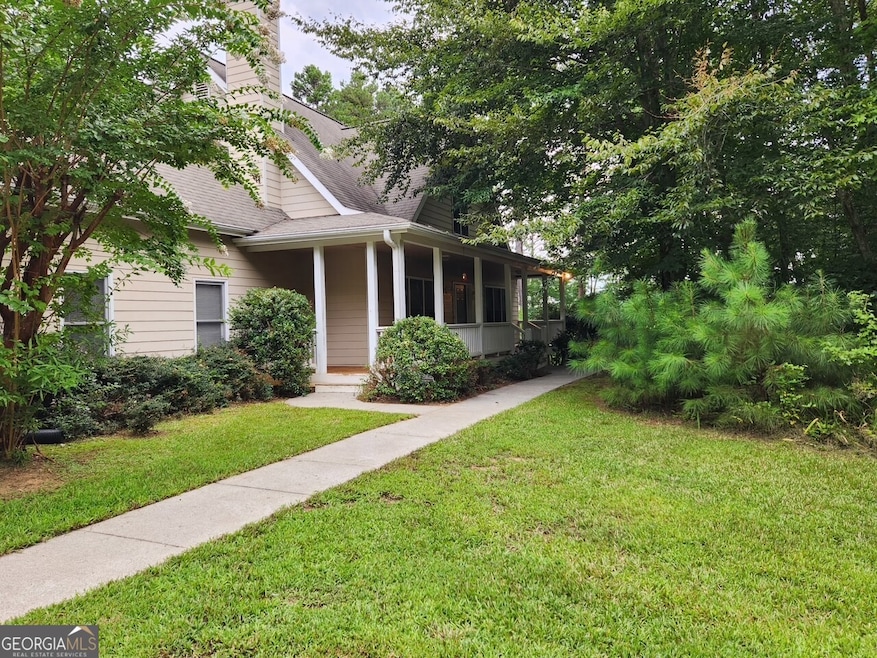
WELCOME TO 125 RAMBLING ROAD - Peaceful Living on 12+ Acres in Fairmont, GA. Tucked away on over 12+ quiet, wooded acres, this charming property offers the best of rural living with space to roam and natural beauty all around. Built in 2003, the home is surrounded by mature apple and pear trees, adding a touch of orchard charm to your everyday. Step inside to discover a warm and welcoming layout, complete with a wood-burning fireplace that sets the tone for cozy evenings. Enjoy your morning coffee or unwind after a long day on the screened-in back porch, perfect for taking in the peaceful sights and sounds of nature. While the home has been lovingly cared for, it offers an opportunity for personal touches and thoughtful updates to truly make it your own. Whether you are dreaming of a quiet homestead, hobby farm, or weekend escape, this property delivers space, privacy, and potential in equal measure. Experience the tranquility of North Georgia!! A MUST SEE with lots of potential.
Last Agent to Sell the Property
Living Down South Realty License #264543 Listed on: 09/10/2025
| Date | Type | Sale Price | Title Company |
|---|---|---|---|
| Limited Warranty Deed | $400,000 | -- | |
| Deed | -- | -- |
| Date | Status | Loan Amount | Loan Type |
|---|---|---|---|
| Open | $200,000 | Unknown |
| Date | Event | Price | List to Sale | Price per Sq Ft |
|---|---|---|---|---|
| 12/02/2025 12/02/25 | Sold | $400,000 | -14.0% | $137 / Sq Ft |
| 10/28/2025 10/28/25 | Pending | -- | -- | -- |
| 09/10/2025 09/10/25 | For Sale | $465,000 | -- | $159 / Sq Ft |
| Year | Tax Paid | Tax Assessment Tax Assessment Total Assessment is a certain percentage of the fair market value that is determined by local assessors to be the total taxable value of land and additions on the property. | Land | Improvement |
|---|---|---|---|---|
| 2025 | $1,702 | $153,440 | $20,800 | $132,640 |
| 2024 | $1,496 | $138,160 | $20,800 | $117,360 |
| 2023 | $1,312 | $131,000 | $20,800 | $110,200 |
| 2022 | $1,028 | $118,508 | $20,800 | $97,708 |
| 2021 | $792 | $100,124 | $20,800 | $79,324 |
| 2020 | $807 | $101,012 | $20,800 | $80,212 |
| 2019 | $809 | $101,012 | $20,800 | $80,212 |
| 2018 | $745 | $94,492 | $20,800 | $73,692 |
| 2017 | $719 | $90,292 | $20,800 | $69,492 |
| 2016 | $720 | $90,292 | $20,800 | $69,492 |
| 2015 | $710 | $88,972 | $20,800 | $68,172 |
| 2014 | $669 | $86,091 | $20,848 | $65,243 |
Seller's Agent in 2025
Leslie Davis
Living Down South Realty
1 in this area
9 Total Sales
Buyer's Agent in 2025
Tiffany Rogers
Atlanta Communities
(404) 670-5643
2 in this area
103 Total Sales
Source: Georgia MLS
MLS Number: 10601136
APN: 129-003
Disclaimer: Certain information contained herein is derived from information provided by parties other than Homes.com. All information provided is deemed reliable, but is not guaranteed to be accurate and should be independently verified.
![]() The data relating to real estate for sale on this web site comes in part from the Broker Reciprocity Program of Georgia MLS. Real estate listings held by brokerage firms other than Redfin are marked with the Broker Reciprocity logo and detailed information about them includes the name of the listing brokers. Information deemed reliable but not guaranteed. Copyright 2026 Georgia MLS. All rights reserved.
The data relating to real estate for sale on this web site comes in part from the Broker Reciprocity Program of Georgia MLS. Real estate listings held by brokerage firms other than Redfin are marked with the Broker Reciprocity logo and detailed information about them includes the name of the listing brokers. Information deemed reliable but not guaranteed. Copyright 2026 Georgia MLS. All rights reserved.
Ask me questions while you tour the home.