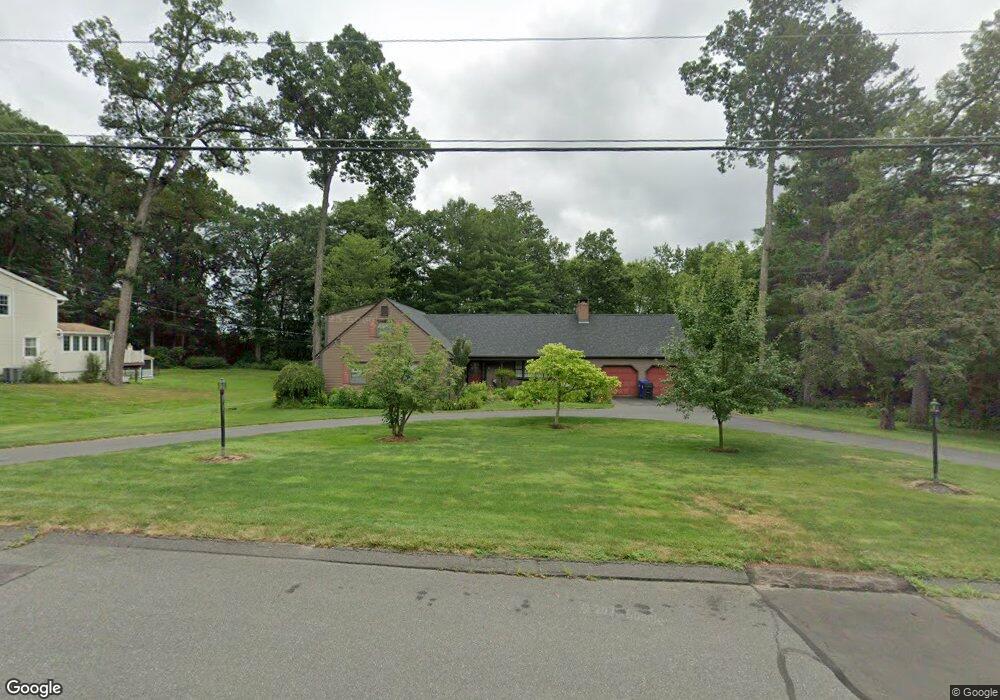
125 Randall Dr Suffield, CT 06078
Estimated Value: $404,000 - $542,000
3
Beds
3
Baths
2,244
Sq Ft
$207/Sq Ft
Est. Value
About This Home
This home is located at 125 Randall Dr, Suffield, CT 06078 and is currently estimated at $463,651, approximately $206 per square foot. 125 Randall Dr is a home located in Hartford County with nearby schools including A. Ward Spaulding School, Mcalister Intermediate School, and Suffield Middle School.
Ownership History
Date
Name
Owned For
Owner Type
Purchase Details
Closed on
Mar 31, 2025
Sold by
Roncaioli Anthony J and Roncaioli Linh B
Bought by
Roncaioli Steven and Roncaioli Sarah
Current Estimated Value
Home Financials for this Owner
Home Financials are based on the most recent Mortgage that was taken out on this home.
Original Mortgage
$315,000
Outstanding Balance
$312,282
Interest Rate
6.87%
Mortgage Type
Purchase Money Mortgage
Estimated Equity
$151,369
Purchase Details
Closed on
May 16, 2013
Sold by
Ct Institute For Blind
Bought by
Roncaioli Anthony J
Home Financials for this Owner
Home Financials are based on the most recent Mortgage that was taken out on this home.
Original Mortgage
$130,000
Interest Rate
3.6%
Purchase Details
Closed on
Jun 20, 1991
Sold by
Seibert Allen and Seibert Ruth
Bought by
Roncaioli Anthony and Bui Linh
Create a Home Valuation Report for This Property
The Home Valuation Report is an in-depth analysis detailing your home's value as well as a comparison with similar homes in the area
Home Values in the Area
Average Home Value in this Area
Purchase History
| Date | Buyer | Sale Price | Title Company |
|---|---|---|---|
| Roncaioli Steven | $393,750 | None Available | |
| Roncaioli Steven | $393,750 | None Available | |
| Roncaioli Anthony J | $240,000 | -- | |
| Roncaioli Anthony J | $240,000 | -- | |
| Roncaioli Anthony | $207,500 | -- |
Source: Public Records
Mortgage History
| Date | Status | Borrower | Loan Amount |
|---|---|---|---|
| Open | Roncaioli Steven | $315,000 | |
| Closed | Roncaioli Steven | $315,000 | |
| Previous Owner | Roncaioli Anthony | $20,000 | |
| Previous Owner | Roncaioli Anthony | $130,000 |
Source: Public Records
Tax History
| Year | Tax Paid | Tax Assessment Tax Assessment Total Assessment is a certain percentage of the fair market value that is determined by local assessors to be the total taxable value of land and additions on the property. | Land | Improvement |
|---|---|---|---|---|
| 2025 | $6,835 | $291,970 | $81,900 | $210,070 |
| 2024 | $6,607 | $291,970 | $81,900 | $210,070 |
| 2023 | $6,863 | $239,890 | $81,900 | $157,990 |
| 2022 | $6,863 | $239,890 | $81,900 | $157,990 |
| 2021 | $6,870 | $239,890 | $81,900 | $157,990 |
| 2020 | $6,870 | $239,890 | $81,900 | $157,990 |
| 2019 | $6,890 | $239,890 | $81,900 | $157,990 |
| 2018 | $6,621 | $225,820 | $75,250 | $150,570 |
| 2017 | $6,524 | $225,820 | $75,250 | $150,570 |
| 2016 | $6,368 | $225,820 | $75,250 | $150,570 |
| 2015 | $6,273 | $225,820 | $75,250 | $150,570 |
| 2014 | $6,124 | $225,820 | $75,250 | $150,570 |
Source: Public Records
Map
Nearby Homes
- Lot 54 North St
- 0 Hickory St Unit 24099336
- 420 Halladay Ave W
- 278 Thompsonville Rd
- 178 Brookfield Ln Unit 178
- 45 Douglas St
- 98 1st St
- 120 2nd St
- 48 Cosgrove Ave
- 3 Martin St
- 20 Manning Rd
- 39 Union Street Extension
- 49 South St
- 30 Church St
- 26 Church St
- 35 Bernardino Ave
- 9 Virginia Ave
- 57 Asnuntuck St
- 60 Lincoln St
- 42 Hartford Ave
- 135 Randall Dr
- 115 Randall Dr
- 115 Shallow Brook Way
- 145 Randall Dr
- 111 Cold Spring Ln
- 126 Randall Dr
- 137 Randall Dr
- 93 Cold Spring Ln
- 121 Shallow Brook Way
- 136 Randall Dr
- 155 Randall Dr
- 110 Ffyler Place
- 146 Randall Dr
- 123 Randall Dr
- 127 Shallow Brook Way
- 118 Shallow Brook Way
- 89 Cold Spring Ln
- 106 Cold Spring Ln
- 116 Randall Dr
- 156 Randall Dr
Your Personal Tour Guide
Ask me questions while you tour the home.