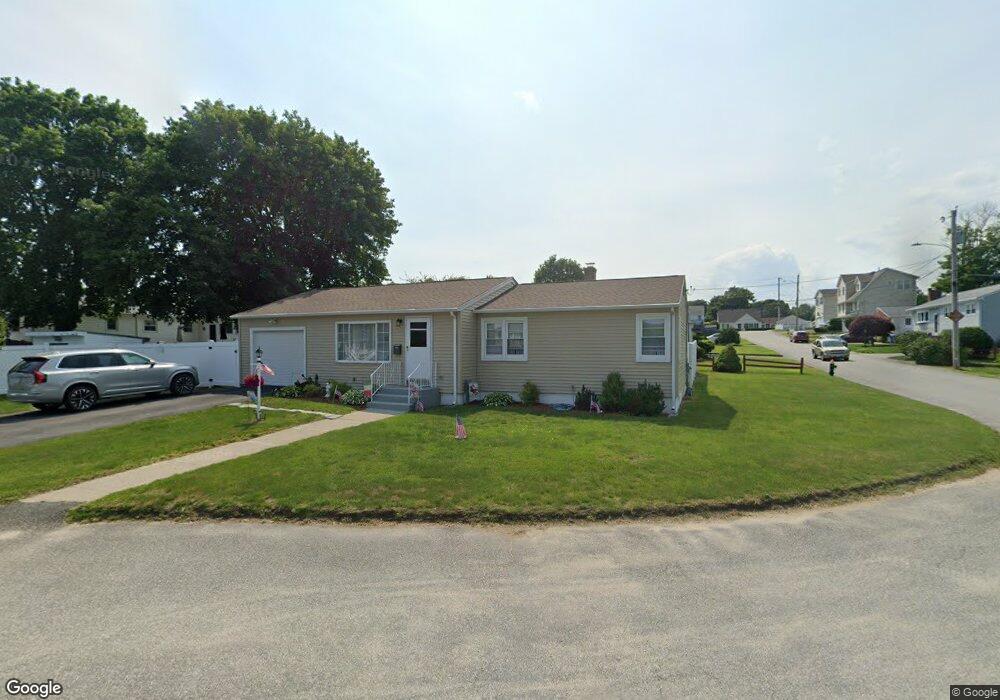
125 Robson St Cranston, RI 02920
Budlong NeighborhoodEstimated Value: $469,719 - $537,000
3
Beds
2
Baths
1,709
Sq Ft
$290/Sq Ft
Est. Value
About This Home
This home is located at 125 Robson St, Cranston, RI 02920 and is currently estimated at $495,930, approximately $290 per square foot. 125 Robson St is a home located in Providence County with nearby schools including Woodridge Elementary School, Western Hills Middle School, and Cranston High School West.
Ownership History
Date
Name
Owned For
Owner Type
Purchase Details
Closed on
May 28, 2010
Sold by
Butniston Tracy W
Bought by
Dewolfe Robert and Dewolfe Joan
Current Estimated Value
Purchase Details
Closed on
Feb 15, 2002
Sold by
Szendro Joseph and Mcgovern Dorothy
Bought by
Weare Harry C
Create a Home Valuation Report for This Property
The Home Valuation Report is an in-depth analysis detailing your home's value as well as a comparison with similar homes in the area
Home Values in the Area
Average Home Value in this Area
Purchase History
| Date | Buyer | Sale Price | Title Company |
|---|---|---|---|
| Dewolfe Robert | $210,000 | -- | |
| Weare Harry C | $159,900 | -- |
Source: Public Records
Mortgage History
| Date | Status | Borrower | Loan Amount |
|---|---|---|---|
| Open | Weare Harry C | $130,000 | |
| Closed | Weare Harry C | $50,000 | |
| Closed | Weare Harry C | $120,500 |
Source: Public Records
Tax History Compared to Growth
Tax History
| Year | Tax Paid | Tax Assessment Tax Assessment Total Assessment is a certain percentage of the fair market value that is determined by local assessors to be the total taxable value of land and additions on the property. | Land | Improvement |
|---|---|---|---|---|
| 2025 | $5,204 | $374,900 | $113,600 | $261,300 |
| 2024 | $5,102 | $374,900 | $113,600 | $261,300 |
| 2023 | $4,734 | $250,500 | $74,800 | $175,700 |
| 2022 | $4,637 | $250,500 | $74,800 | $175,700 |
| 2021 | $4,509 | $250,500 | $74,800 | $175,700 |
| 2020 | $4,243 | $204,300 | $71,200 | $133,100 |
| 2019 | $4,243 | $204,300 | $71,200 | $133,100 |
| 2018 | $4,145 | $204,300 | $71,200 | $133,100 |
| 2017 | $3,904 | $170,200 | $64,100 | $106,100 |
| 2016 | $3,821 | $170,200 | $64,100 | $106,100 |
| 2015 | $3,821 | $170,200 | $64,100 | $106,100 |
| 2014 | $3,976 | $174,100 | $64,100 | $110,000 |
Source: Public Records
Map
Nearby Homes
- 111 Belgium St
- 46 Roslyn Ave
- 55 Columbus Blvd
- 99 Salem Ave
- 69 W View Ave
- 0 Rutland St
- 446 Budlong Rd
- 12 Stevens Rd
- 10 Sheffield Rd
- 210 Hyde St
- 92 Rhode Island St
- 140 Concord Ave
- 1455 Park Ave Unit 3
- 63 Packard St
- 80 Packard St
- 130 Wollaston St
- 141 Glen Ridge Rd
- 80 Phenix Ave
- 28 Hybrid Dr
- 174 Gansett Ave