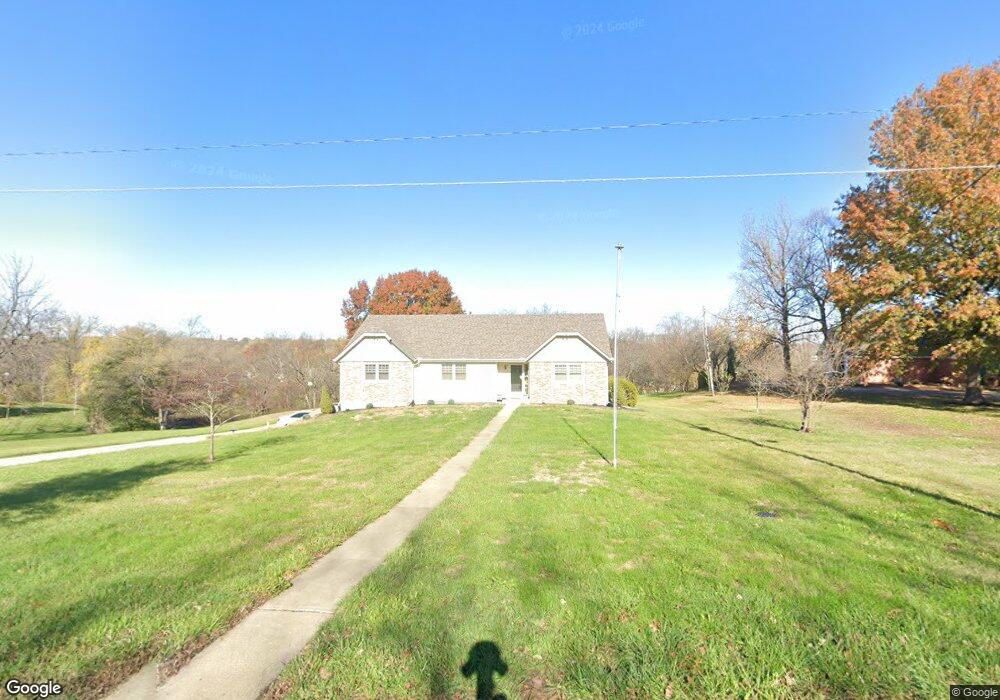
125 Rock Creek Loop Lansing, KS 66043
Estimated Value: $374,000 - $524,000
3
Beds
3
Baths
1,901
Sq Ft
$226/Sq Ft
Est. Value
About This Home
This home is located at 125 Rock Creek Loop, Lansing, KS 66043 and is currently estimated at $430,558, approximately $226 per square foot. 125 Rock Creek Loop is a home located in Leavenworth County with nearby schools including Lansing Elementary School, Lansing Middle 6-8, and Lansing High 9-12.
Ownership History
Date
Name
Owned For
Owner Type
Purchase Details
Closed on
May 1, 1991
Bought by
Bradford John W and Bradford Donna M
Current Estimated Value
Home Financials for this Owner
Home Financials are based on the most recent Mortgage that was taken out on this home.
Original Mortgage
$280,976
Outstanding Balance
$135,675
Interest Rate
9.53%
Mortgage Type
VA
Estimated Equity
$294,883
Create a Home Valuation Report for This Property
The Home Valuation Report is an in-depth analysis detailing your home's value as well as a comparison with similar homes in the area
Home Values in the Area
Average Home Value in this Area
Purchase History
| Date | Buyer | Sale Price | Title Company |
|---|---|---|---|
| Bradford John W | $157,000 | -- |
Source: Public Records
Mortgage History
| Date | Status | Borrower | Loan Amount |
|---|---|---|---|
| Open | Bradford John W | $280,976 | |
| Closed | Bradford John W | $50,000 |
Source: Public Records
Tax History Compared to Growth
Tax History
| Year | Tax Paid | Tax Assessment Tax Assessment Total Assessment is a certain percentage of the fair market value that is determined by local assessors to be the total taxable value of land and additions on the property. | Land | Improvement |
|---|---|---|---|---|
| 2025 | $5,749 | $44,068 | $7,444 | $36,624 |
| 2024 | $5,327 | $42,554 | $7,520 | $35,034 |
| 2023 | $5,327 | $40,919 | $7,520 | $33,399 |
| 2022 | $5,123 | $37,202 | $5,700 | $31,502 |
| 2021 | $4,988 | $34,591 | $5,700 | $28,891 |
| 2020 | $4,973 | $33,936 | $5,700 | $28,236 |
| 2019 | $4,980 | $33,933 | $5,697 | $28,236 |
| 2018 | $4,723 | $32,218 | $5,691 | $26,527 |
| 2017 | $4,764 | $32,417 | $6,863 | $25,554 |
| 2016 | $4,718 | $32,096 | $6,863 | $25,233 |
| 2015 | $4,809 | $32,804 | $8,830 | $23,974 |
| 2014 | $4,463 | $31,096 | $8,830 | $22,266 |
Source: Public Records
Map
Nearby Homes
- 131 Rock Creek Loop
- 115 W Gilman Rd
- 705 Rock Creek Dr
- 875 Clearview Dr
- 922 Southfork St
- 901 S Main St
- 833 Rock Creek Dr
- 13788 McIntyre2 Rd
- 13788 McIntyre1 Rd
- 13788 Mcintyre Rd
- 24431 139th St
- 722 Bittersweet Rd
- 1221 S Desoto Rd
- 811 4-H Rd
- 13965 Mc Intyre Rd
- 624 S Bittersweet Ln
- 104 Olive St
- 527 S Valley Dr
- 000 4-H Rd
- 506 1st Terrace
- 127 Rock Creek Loop
- 123 Rock Creek Loop
- 129 Rock Creek Loop
- 128 Rock Creek Loop
- 121 Rock Creek Loop
- 119 Rock Creek Loop
- 121 W Gilman Rd
- 118 Rock Creek Loop
- 133 Rock Creek Loop
- 109 Willow Dr
- 111 Willow Dr
- 135 Rock Creek Loop
- 113 Willow Dr
- 107 Willow Dr
- 115 Willow Dr
- 117 Willow Dr
- 105 Willow Dr
- 117 Rock Creek Loop
- 104 Rock Creek Loop
- 119 Willow St