
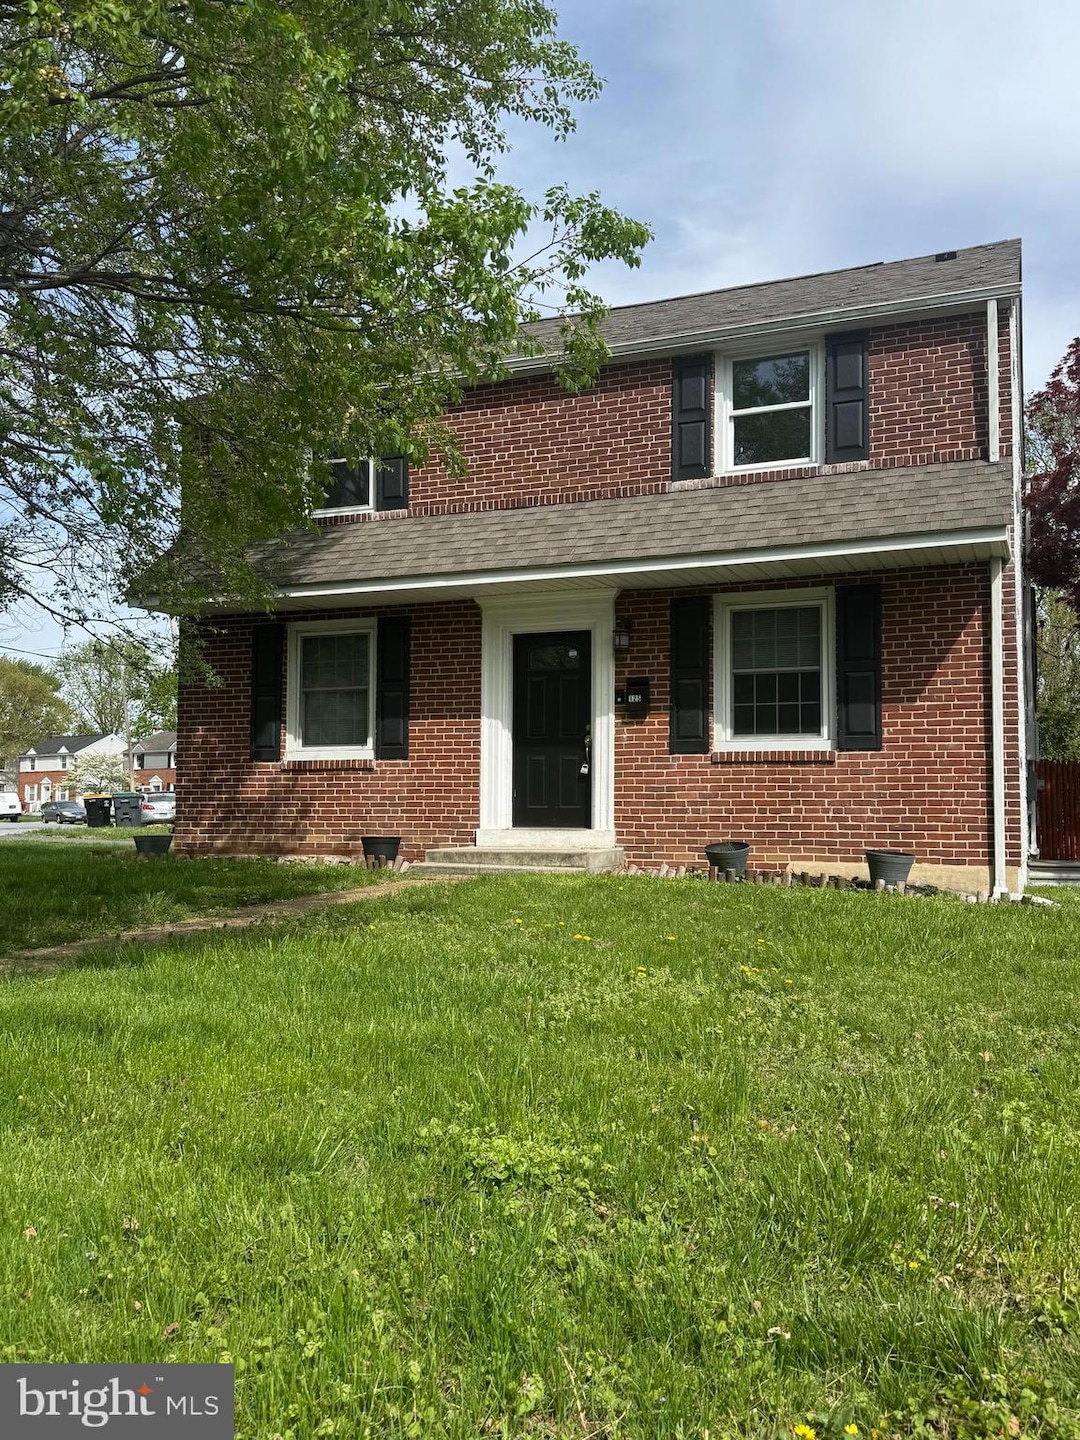


125 Rodney Dr New Castle, DE 19720
3
Beds
2.5
Baths
1,225
Sq Ft
8,276
Sq Ft Lot
Highlights
- Colonial Architecture
- No HOA
- Stainless Steel Appliances
- Wood Flooring
- Upgraded Countertops
- Eat-In Kitchen
About This Home
As of June 2025Completely renovated in 2019. Freshly painted in April 2025 and professionally cleaned. Home offers a large amount of space including a finished basement with a full bathroom and a large fenced yard with above ground pool(as is). You'll love the kitchen - loaded with stainless appliances, granite countertops and ceramic tile flooring. The living room has beautiful hardwood flooring and wainscotting. Close to commuter routes into NJ and Philly, the Wilmington Train Station and the Wilmington Airport.
Last Agent to Sell the Property
Empower Real Estate, LLC License #649514 Listed on: 12/14/2024
Home Details
Home Type
- Single Family
Est. Annual Taxes
- $1,178
Year Built
- Built in 1948
Lot Details
- 8,276 Sq Ft Lot
- Lot Dimensions are 69.10 x 124.80
- Northwest Facing Home
- Privacy Fence
- Wood Fence
- Back and Front Yard
- Property is zoned NC5
Home Design
- Colonial Architecture
- Brick Exterior Construction
- Block Foundation
- Pitched Roof
- Shingle Roof
- Asphalt Roof
- Stucco
Interior Spaces
- 1,225 Sq Ft Home
- Property has 2 Levels
- Recessed Lighting
- Awning
- Family Room
- Living Room
- Fire and Smoke Detector
Kitchen
- Eat-In Kitchen
- Electric Oven or Range
- Built-In Microwave
- Dishwasher
- Stainless Steel Appliances
- Upgraded Countertops
Flooring
- Wood
- Carpet
- Ceramic Tile
Bedrooms and Bathrooms
- 3 Bedrooms
- En-Suite Primary Bedroom
- Bathtub with Shower
- Walk-in Shower
Laundry
- Laundry Room
- Dryer
- Washer
Finished Basement
- Basement Fills Entire Space Under The House
- Laundry in Basement
- Basement Windows
Parking
- 2 Parking Spaces
- 2 Driveway Spaces
Outdoor Features
- Patio
- Shed
Location
- Suburban Location
Utilities
- Forced Air Heating and Cooling System
- 200+ Amp Service
- 120/240V
- Electric Water Heater
- Cable TV Available
Community Details
- No Home Owners Association
- Collins Park Subdivision
Listing and Financial Details
- Tax Lot 208
- Assessor Parcel Number 10-015.40-208
Ownership History
Date
Name
Owned For
Owner Type
Purchase Details
Listed on
Dec 14, 2024
Closed on
Jun 23, 2025
Sold by
Robinson Eric C
Bought by
Villalva Angela
Seller's Agent
Maria Ruckle
Empower Real Estate, LLC
Buyer's Agent
Dawn Bright
Tesla Realty Group, LLC
List Price
$334,900
Sold Price
$324,900
Premium/Discount to List
-$10,000
-2.99%
Views
427
Home Financials for this Owner
Home Financials are based on the most recent Mortgage that was taken out on this home.
Avg. Annual Appreciation
-30.68%
Original Mortgage
$314,056
Outstanding Balance
$314,056
Interest Rate
6.81%
Mortgage Type
FHA
Estimated Equity
$1,458
Purchase Details
Listed on
May 13, 2019
Closed on
Jul 1, 2019
Sold by
Stape Jeffrey P
Bought by
Robinson Eric C
Seller's Agent
Jeff Stape
Compass
Buyer's Agent
BRANDON L. HOHREIN
Keller Williams Realty Central-Delaware
List Price
$199,950
Sold Price
$199,900
Premium/Discount to List
-$50
-0.03%
Home Financials for this Owner
Home Financials are based on the most recent Mortgage that was taken out on this home.
Avg. Annual Appreciation
8.46%
Original Mortgage
$196,278
Interest Rate
3.87%
Mortgage Type
FHA
Purchase Details
Listed on
Jan 2, 2018
Closed on
Nov 16, 2018
Sold by
Cale Ashia D
Bought by
Stape Jeffrey P
Seller's Agent
Craig Blango
Keller Williams Realty Wilmington
Buyer's Agent
Craig Blango
Keller Williams Realty Wilmington
List Price
$120,000
Sold Price
$79,000
Premium/Discount to List
-$41,000
-34.17%
Home Financials for this Owner
Home Financials are based on the most recent Mortgage that was taken out on this home.
Avg. Annual Appreciation
346.99%
Purchase Details
Listed on
May 21, 2012
Closed on
Sep 1, 2012
Sold by
Tyre Charles R and Tyre Tara L
Bought by
Cale Ashia D
Seller's Agent
Lisa Marie
RE/MAX Edge
Buyer's Agent
CONNIE WILLIAMS
BHHS Fox & Roach-Christiana
List Price
$149,900
Sold Price
$132,000
Premium/Discount to List
-$17,900
-11.94%
Home Financials for this Owner
Home Financials are based on the most recent Mortgage that was taken out on this home.
Avg. Annual Appreciation
-8.03%
Original Mortgage
$10,000
Interest Rate
3.59%
Mortgage Type
Stand Alone Second
Purchase Details
Closed on
May 10, 2010
Sold by
Homer Sonja and Homer Derrick
Bought by
Tyre Charles R and Tyre Tara L
Purchase Details
Closed on
Jan 11, 2006
Sold by
Homer Derrick
Bought by
Homer Derrick and Homer Sonja
Home Financials for this Owner
Home Financials are based on the most recent Mortgage that was taken out on this home.
Original Mortgage
$126,525
Interest Rate
9.99%
Mortgage Type
Fannie Mae Freddie Mac
Purchase Details
Closed on
Dec 20, 2002
Sold by
Conner Donna Lea
Bought by
Homer Derrick
Home Financials for this Owner
Home Financials are based on the most recent Mortgage that was taken out on this home.
Original Mortgage
$109,155
Interest Rate
9.74%
Mortgage Type
Purchase Money Mortgage
Similar Homes in New Castle, DE
Create a Home Valuation Report for This Property
The Home Valuation Report is an in-depth analysis detailing your home's value as well as a comparison with similar homes in the area
Home Values in the Area
Average Home Value in this Area
Purchase History
| Date | Type | Sale Price | Title Company |
|---|---|---|---|
| Deed | $259,920 | None Listed On Document | |
| Deed | -- | None Available | |
| Deed | -- | None Available | |
| Deed | $99,000 | None Available | |
| Deed | $93,500 | None Available | |
| Interfamily Deed Transfer | -- | None Available | |
| Deed | $114,900 | -- |
Source: Public Records
Mortgage History
| Date | Status | Loan Amount | Loan Type |
|---|---|---|---|
| Open | $314,056 | FHA | |
| Previous Owner | $195,759 | FHA | |
| Previous Owner | $196,620 | Stand Alone Refi Refinance Of Original Loan | |
| Previous Owner | $196,278 | FHA | |
| Previous Owner | $10,000 | Stand Alone Second | |
| Previous Owner | $129,609 | FHA | |
| Previous Owner | $171,636 | FHA | |
| Previous Owner | $146,400 | Unknown | |
| Previous Owner | $126,525 | Fannie Mae Freddie Mac | |
| Previous Owner | $109,155 | Purchase Money Mortgage |
Source: Public Records
Property History
| Date | Event | Price | Change | Sq Ft Price |
|---|---|---|---|---|
| 06/23/2025 06/23/25 | Sold | $324,900 | 0.0% | $265 / Sq Ft |
| 05/16/2025 05/16/25 | Price Changed | $324,900 | -3.0% | $265 / Sq Ft |
| 04/22/2025 04/22/25 | Price Changed | $334,900 | 0.0% | $273 / Sq Ft |
| 04/22/2025 04/22/25 | For Sale | $334,900 | +15.5% | $273 / Sq Ft |
| 01/15/2025 01/15/25 | Pending | -- | -- | -- |
| 12/14/2024 12/14/24 | For Sale | $289,900 | +45.0% | $237 / Sq Ft |
| 07/01/2019 07/01/19 | Sold | $199,900 | 0.0% | $110 / Sq Ft |
| 05/14/2019 05/14/19 | Pending | -- | -- | -- |
| 05/13/2019 05/13/19 | Price Changed | $199,900 | 0.0% | $110 / Sq Ft |
| 05/13/2019 05/13/19 | For Sale | $199,950 | +153.1% | $110 / Sq Ft |
| 11/16/2018 11/16/18 | Sold | $79,000 | -21.0% | $64 / Sq Ft |
| 06/19/2018 06/19/18 | Pending | -- | -- | -- |
| 06/19/2018 06/19/18 | Price Changed | $100,000 | -16.7% | $82 / Sq Ft |
| 06/15/2018 06/15/18 | Price Changed | $120,000 | 0.0% | $98 / Sq Ft |
| 06/15/2018 06/15/18 | For Sale | $120,000 | +51.9% | $98 / Sq Ft |
| 06/12/2018 06/12/18 | Off Market | $79,000 | -- | -- |
| 02/03/2018 02/03/18 | Price Changed | $125,000 | -3.8% | $102 / Sq Ft |
| 01/29/2018 01/29/18 | Price Changed | $130,000 | -3.7% | $106 / Sq Ft |
| 01/28/2018 01/28/18 | Pending | -- | -- | -- |
| 01/26/2018 01/26/18 | Price Changed | $135,000 | -3.6% | $110 / Sq Ft |
| 01/23/2018 01/23/18 | Price Changed | $140,000 | -6.0% | $114 / Sq Ft |
| 01/22/2018 01/22/18 | Price Changed | $149,000 | -3.9% | $122 / Sq Ft |
| 01/16/2018 01/16/18 | Price Changed | $155,000 | -3.1% | $127 / Sq Ft |
| 01/02/2018 01/02/18 | For Sale | $160,000 | +21.2% | $131 / Sq Ft |
| 09/29/2012 09/29/12 | Sold | $132,000 | -5.0% | $108 / Sq Ft |
| 09/28/2012 09/28/12 | Pending | -- | -- | -- |
| 07/22/2012 07/22/12 | Price Changed | $138,900 | -7.3% | $113 / Sq Ft |
| 05/21/2012 05/21/12 | For Sale | $149,900 | -- | $122 / Sq Ft |
Source: Bright MLS
Tax History Compared to Growth
Tax History
| Year | Tax Paid | Tax Assessment Tax Assessment Total Assessment is a certain percentage of the fair market value that is determined by local assessors to be the total taxable value of land and additions on the property. | Land | Improvement |
|---|---|---|---|---|
| 2024 | $1,294 | $37,700 | $6,000 | $31,700 |
| 2023 | $1,177 | $37,700 | $6,000 | $31,700 |
| 2022 | $1,226 | $37,700 | $6,000 | $31,700 |
| 2021 | $1,226 | $37,700 | $6,000 | $31,700 |
| 2020 | $1,167 | $35,700 | $6,000 | $29,700 |
| 2019 | $1,357 | $35,700 | $6,000 | $29,700 |
| 2018 | $540 | $35,700 | $6,000 | $29,700 |
| 2017 | $958 | $35,700 | $6,000 | $29,700 |
| 2016 | $958 | $35,700 | $6,000 | $29,700 |
| 2015 | $957 | $35,700 | $6,000 | $29,700 |
| 2014 | $958 | $35,700 | $6,000 | $29,700 |
Source: Public Records
Agents Affiliated with this Home
-
Seller's Agent in 2025
Maria Ruckle
Empower Real Estate, LLC
(302) 893-1601
3 in this area
248 Total Sales
-
Buyer's Agent in 2025
Dawn Bright
Tesla Realty Group, LLC
(610) 322-7643
2 in this area
43 Total Sales
-
Seller's Agent in 2019
Jeff Stape
Compass
(302) 202-9855
10 in this area
315 Total Sales
-
B
Buyer's Agent in 2019
BRANDON L. HOHREIN
Keller Williams Realty Central-Delaware
(610) 233-8195
77 Total Sales
-
C
Seller's Agent in 2018
Craig Blango
Keller Williams Realty Wilmington
-
Seller's Agent in 2012
Lisa Marie
RE/MAX
(302) 753-8367
119 Total Sales
Map
Source: Bright MLS
MLS Number: DENC2073350
APN: 10-015.40-208
Disclaimer: Certain information contained herein is derived from information provided by parties other than Homes.com. All information provided is deemed reliable, but is not guaranteed to be accurate and should be independently verified.
![]() The data relating to real estate for sale on this website appears in part through the BRIGHT Internet Data Exchange program, a voluntary cooperative exchange of property listing data between licensed real estate brokerage firms, and is provided by BRIGHT through a licensing agreement.
The data relating to real estate for sale on this website appears in part through the BRIGHT Internet Data Exchange program, a voluntary cooperative exchange of property listing data between licensed real estate brokerage firms, and is provided by BRIGHT through a licensing agreement.
Listing information is from various brokers who participate in the Bright MLS IDX program and not all listings may be visible on the site.
The property information being provided on or through the website is for the personal, non-commercial use of consumers and such information may not be used for any purpose other than to identify prospective properties consumers may be interested in purchasing.
Some properties which appear for sale on the website may no longer be available because they are for instance, under contract, sold or are no longer being offered for sale.
Property information displayed is deemed reliable but is not guaranteed.
Copyright 2025 Bright MLS, Inc.
Nearby Homes
- 140 Bellanca Ln
- 183 Riverview Dr
- 172 Riverview Dr
- 3100 New Castle Ave
- 106 Killoran Dr
- 208 Keiser Place
- 315 Mcginn Place
- 306 Elwood Place
- 142 Somers Ave
- 132 Edge Ave
- 39 Roxeter Rd
- 38 Buttonwood Ave
- 423 Howell Dr
- 416 Howell Dr
- 60 Landers Ln
- 184 Edge Ave
- 436 Howell Dr
- 30 Wardor Ave
- 17 Deborah Ave
- 5 Garden Ln