Estimated Value: $108,000 - $130,000
3
Beds
2
Baths
1,784
Sq Ft
$66/Sq Ft
Est. Value
About This Home
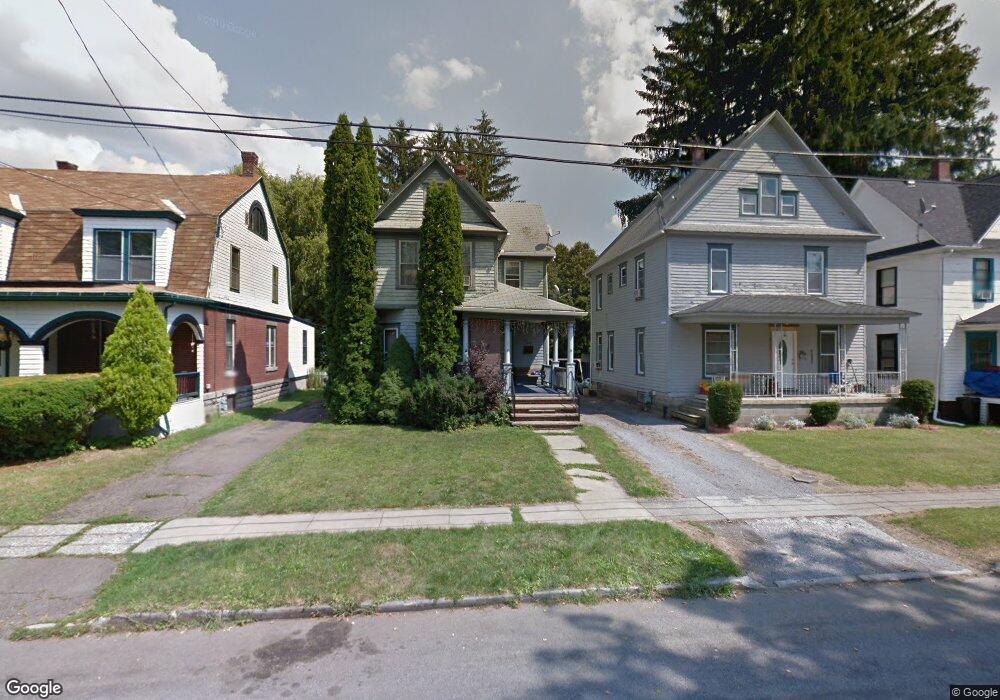
This home is located at 125 S 8th St, Olean, NY 14760 and is currently estimated at $118,166, approximately $66 per square foot. 125 S 8th St is a home located in Cattaraugus County with nearby schools including Olean Intermediate-Middle School, Olean Senior High School, and Southern Tier Catholic School.
Ownership History
Date
Name
Owned For
Owner Type
Purchase Details
Closed on
Feb 13, 2025
Sold by
Adrian Dominga M
Bought by
Balansag Velmore and Balansag Adrian Dominga
Current Estimated Value
Purchase Details
Closed on
Aug 23, 2016
Sold by
Adrian Dominga
Bought by
Adrian Dominga M
Purchase Details
Closed on
Jun 17, 2014
Sold by
Griffin Cathy M
Bought by
Adrian Dominga
Purchase Details
Closed on
Sep 30, 1996
Sold by
Eaton John R and Eaton Wendy L
Bought by
Griffin Cathy M
Create a Home Valuation Report for This Property
The Home Valuation Report is an in-depth analysis detailing your home's value as well as a comparison with similar homes in the area
Home Values in the Area
Average Home Value in this Area
Purchase History
| Date | Buyer | Sale Price | Title Company |
|---|---|---|---|
| Balansag Velmore | -- | None Available | |
| Adrian Dominga M | -- | Elizabeth Bertrand | |
| Adrian Dominga M | -- | Elizabeth Bertrand | |
| Adrian Dominga | $55,000 | -- | |
| Adrian Dominga | $55,000 | -- | |
| Griffin Cathy M | $55,000 | -- | |
| Griffin Cathy M | $55,000 | -- |
Source: Public Records
Tax History
| Year | Tax Paid | Tax Assessment Tax Assessment Total Assessment is a certain percentage of the fair market value that is determined by local assessors to be the total taxable value of land and additions on the property. | Land | Improvement |
|---|---|---|---|---|
| 2024 | $2,213 | $35,000 | $5,100 | $29,900 |
| 2023 | $1,318 | $35,000 | $5,100 | $29,900 |
| 2022 | $1,337 | $35,000 | $5,100 | $29,900 |
| 2021 | $1,375 | $35,000 | $5,100 | $29,900 |
| 2020 | $744 | $35,000 | $5,100 | $29,900 |
| 2019 | $525 | $35,000 | $5,100 | $29,900 |
| 2018 | $1,831 | $35,000 | $5,100 | $29,900 |
| 2017 | $1,010 | $35,000 | $5,100 | $29,900 |
| 2016 | $709 | $35,000 | $5,100 | $29,900 |
| 2015 | -- | $35,000 | $5,100 | $29,900 |
| 2014 | -- | $35,000 | $5,100 | $29,900 |
Source: Public Records
Map
Nearby Homes
Your Personal Tour Guide
Ask me questions while you tour the home.