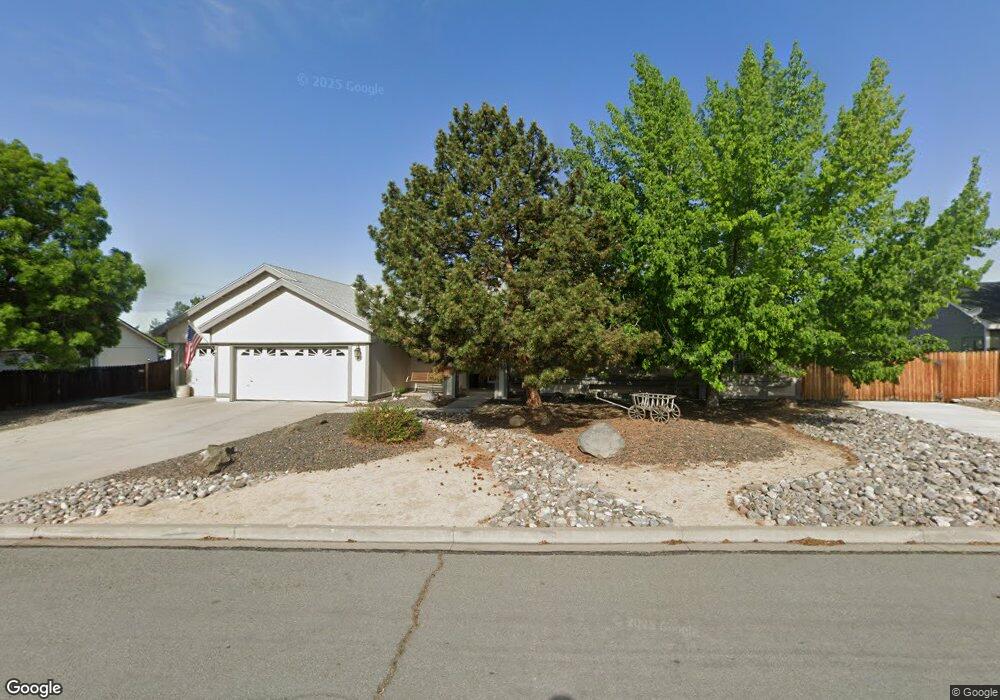
125 Starburst Cir Sparks, NV 89441
Sky Ranch NeighborhoodEstimated Value: $738,349 - $856,000
3
Beds
2
Baths
2,111
Sq Ft
$388/Sq Ft
Est. Value
About This Home
This home is located at 125 Starburst Cir, Sparks, NV 89441 and is currently estimated at $819,087, approximately $388 per square foot. 125 Starburst Cir is a home located in Washoe County with nearby schools including Spanish Springs Elementary School, Yvonne Shaw Middle School, and Spanish Springs High School.
Ownership History
Date
Name
Owned For
Owner Type
Purchase Details
Closed on
Aug 25, 2022
Sold by
Lynn Simpson Donna
Bought by
Dls Living Trust
Current Estimated Value
Purchase Details
Closed on
Mar 26, 2012
Sold by
Simpson Donna L and Simpson Donna Lynn
Bought by
Simpson Donna L
Home Financials for this Owner
Home Financials are based on the most recent Mortgage that was taken out on this home.
Original Mortgage
$306,000
Interest Rate
3.83%
Mortgage Type
New Conventional
Purchase Details
Closed on
Feb 24, 1997
Sold by
Confer Judy E
Bought by
Simpson Donna Lynn
Home Financials for this Owner
Home Financials are based on the most recent Mortgage that was taken out on this home.
Original Mortgage
$105,000
Interest Rate
7.86%
Create a Home Valuation Report for This Property
The Home Valuation Report is an in-depth analysis detailing your home's value as well as a comparison with similar homes in the area
Home Values in the Area
Average Home Value in this Area
Purchase History
| Date | Buyer | Sale Price | Title Company |
|---|---|---|---|
| Dls Living Trust | -- | -- | |
| Simpson Donna L | -- | Western Title Company | |
| Simpson Donna Lynn | $205,000 | Stewart Title | |
| Confer Judy E | -- | Stewart Title |
Source: Public Records
Mortgage History
| Date | Status | Borrower | Loan Amount |
|---|---|---|---|
| Previous Owner | Simpson Donna L | $306,000 | |
| Previous Owner | Simpson Donna Lynn | $105,000 |
Source: Public Records
Tax History Compared to Growth
Tax History
| Year | Tax Paid | Tax Assessment Tax Assessment Total Assessment is a certain percentage of the fair market value that is determined by local assessors to be the total taxable value of land and additions on the property. | Land | Improvement |
|---|---|---|---|---|
| 2025 | $2,458 | $139,403 | $62,720 | $76,683 |
| 2024 | $2,458 | $132,520 | $54,635 | $77,885 |
| 2023 | $2,833 | $127,635 | $53,795 | $73,840 |
| 2022 | $2,404 | $111,444 | $49,525 | $61,919 |
| 2021 | $2,440 | $100,932 | $39,060 | $61,872 |
| 2020 | $2,741 | $96,465 | $35,070 | $61,395 |
| 2019 | $2,661 | $94,605 | $34,930 | $59,675 |
| 2018 | $2,333 | $82,403 | $23,660 | $58,743 |
| 2017 | $2,509 | $81,083 | $21,980 | $59,103 |
| 2016 | $2,445 | $79,797 | $19,425 | $60,372 |
| 2015 | $2,440 | $79,434 | $19,005 | $60,429 |
| 2014 | $2,369 | $74,933 | $16,310 | $58,623 |
| 2013 | -- | $70,983 | $13,125 | $57,858 |
Source: Public Records
Map
Nearby Homes
- 281 Saintsbury Ct
- 260 Virgil Dr
- 245 Moonbeam Dr Unit 5
- 335 Cortez Ct
- 75 Mclemore Ct
- 440 Aswan St
- 2444 Butte Creek Dr
- 415 Sunset Springs Ln
- 8044 Miramar Ct
- 2449 Butte Creek Dr
- 2182 Butte Creek Dr
- 20 Carneros Dr
- 9005 Spanish Trail Dr
- 65 Eclipse Dr
- 2252 Selway Dr
- 200 Great Vine Ct
- 291 Omni Dr
- 2248 Musselshell Dr
- 3131 Manzana Ct
- 2151 Roaring Fork Ct
- 105 Starburst Cir
- 135 Starburst Cir
- 120 Starburst Cir Unit 3
- 110 Starburst Cir Unit 2
- 130 Starburst Cir
- 100 Starburst Cir
- 20 Morning Mist Ln
- 30 Morning Mist Ct
- 90 Starburst Cir
- 45 Starburst Cir
- 380 Omni Dr
- 378 Omni Dr
- 25 Morning Mist Ln
- 35 Starburst Cir
- 35 Morning Mist Ln
- 40 Morning Mist Ct
- 376 Omni Dr
- 15 Morning Mist Ln
- 45 Morning Mist Ct
- 80 Starburst Ct Unit 3