125 Surf Way Unit 304 Monterey, CA 93940
Del Monte Beach NeighborhoodEstimated Value: $602,790 - $715,000
1
Bed
1
Bath
513
Sq Ft
$1,315/Sq Ft
Est. Value
About This Home
This home is located at 125 Surf Way Unit 304, Monterey, CA 93940 and is currently estimated at $674,698, approximately $1,315 per square foot. 125 Surf Way Unit 304 is a home located in Monterey County with nearby schools including Foothill Elementary School, Monte Vista Elementary School, and Monterey High School.
Ownership History
Date
Name
Owned For
Owner Type
Purchase Details
Closed on
Apr 22, 2021
Sold by
Schumacher Elaine D
Bought by
Schumacher Elaine D and The Elaine D Schumacher Living
Current Estimated Value
Home Financials for this Owner
Home Financials are based on the most recent Mortgage that was taken out on this home.
Original Mortgage
$325,000
Outstanding Balance
$293,436
Interest Rate
3%
Mortgage Type
New Conventional
Estimated Equity
$381,262
Purchase Details
Closed on
Aug 19, 2009
Sold by
Schumacher Elaine Dorothy
Bought by
Schumacher Elaine D
Purchase Details
Closed on
May 15, 1996
Sold by
Theobalt Inge M
Bought by
Theobalt Inge M
Purchase Details
Closed on
Jul 27, 1995
Sold by
Billington Charles J and Billington Frances
Bought by
Appel Judith C
Home Financials for this Owner
Home Financials are based on the most recent Mortgage that was taken out on this home.
Original Mortgage
$155,000
Interest Rate
7.61%
Create a Home Valuation Report for This Property
The Home Valuation Report is an in-depth analysis detailing your home's value as well as a comparison with similar homes in the area
Home Values in the Area
Average Home Value in this Area
Purchase History
| Date | Buyer | Sale Price | Title Company |
|---|---|---|---|
| Schumacher Elaine D | -- | First Amer Ttl Co Res Div | |
| Schumacher Elaine D | -- | First Amer Ttl Co Res Div | |
| Schumacher Elaine D | -- | None Available | |
| Theobalt Inge M | -- | -- | |
| Appel Judith C | $198,500 | Chicago Title Co |
Source: Public Records
Mortgage History
| Date | Status | Borrower | Loan Amount |
|---|---|---|---|
| Open | Schumacher Elaine D | $325,000 | |
| Closed | Appel Judith C | $155,000 |
Source: Public Records
Tax History Compared to Growth
Tax History
| Year | Tax Paid | Tax Assessment Tax Assessment Total Assessment is a certain percentage of the fair market value that is determined by local assessors to be the total taxable value of land and additions on the property. | Land | Improvement |
|---|---|---|---|---|
| 2025 | $2,916 | $261,699 | $127,451 | $134,248 |
| 2024 | $2,916 | $256,568 | $124,952 | $131,616 |
| 2023 | $2,764 | $251,538 | $122,502 | $129,036 |
| 2022 | $2,725 | $246,606 | $120,100 | $126,506 |
| 2021 | $2,686 | $241,772 | $117,746 | $124,026 |
| 2020 | $2,584 | $239,294 | $116,539 | $122,755 |
| 2019 | $2,710 | $234,603 | $114,254 | $120,349 |
| 2018 | $2,603 | $230,004 | $112,014 | $117,990 |
| 2017 | $2,411 | $225,495 | $109,818 | $115,677 |
| 2016 | $2,368 | $221,074 | $107,665 | $113,409 |
| 2015 | $2,334 | $217,754 | $106,048 | $111,706 |
| 2014 | $2,294 | $213,489 | $103,971 | $109,518 |
Source: Public Records
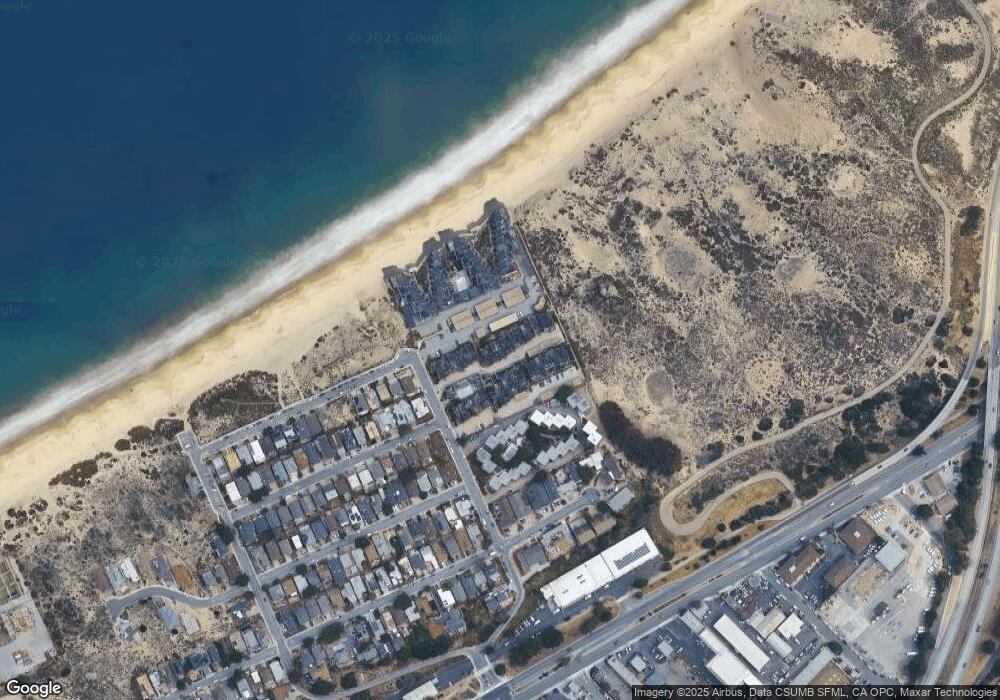
Map
Nearby Homes
- 125 Surf Way Unit 433
- 125 Surf Way Unit 434
- 125 Surf Way Unit 343
- 125 Surf Way Unit 305
- 1 Surf Way Unit 122
- 1 Surf Way Unit 228
- 105 Roberts Ave
- 6 Spray Ave
- 361 Hannon Ave
- 415 Hannon Ave
- 425 Alcalde Ave
- 459 English Ave
- 461 Dela Vina Ave Unit 209
- 1388 Canyon Del Rey Blvd
- 401 Sequoia Ave
- 548 Hannon Ave
- 542 English Ave
- 300 Orange Ave
- 43 La Playa St
- 570 Casanova Ave
- 125 Surf Way Unit 424
- 125 Surf Way Unit 325
- 125 Surf Way Unit 427
- 125 Surf Way Unit 418
- 125 Surf Way Unit 410
- 125 Surf Way Unit 415
- 125 Surf Way Unit 315
- 125 Surf Way Unit 439
- 125 Surf Way Unit 331
- 125 Surf Way Unit 409
- 125 Surf Way Unit 324
- 125 Surf Way Unit 318
- 125 Surf Way Unit 316
- 125 Surf Way Unit 338
- 125 Surf Way Unit 308
- 125 Surf Way Unit 431
- 125 Surf Way Unit 302
- 125 Surf Way Unit 402
- 125 Surf Way Unit 340
- 125 Surf Way Unit 342