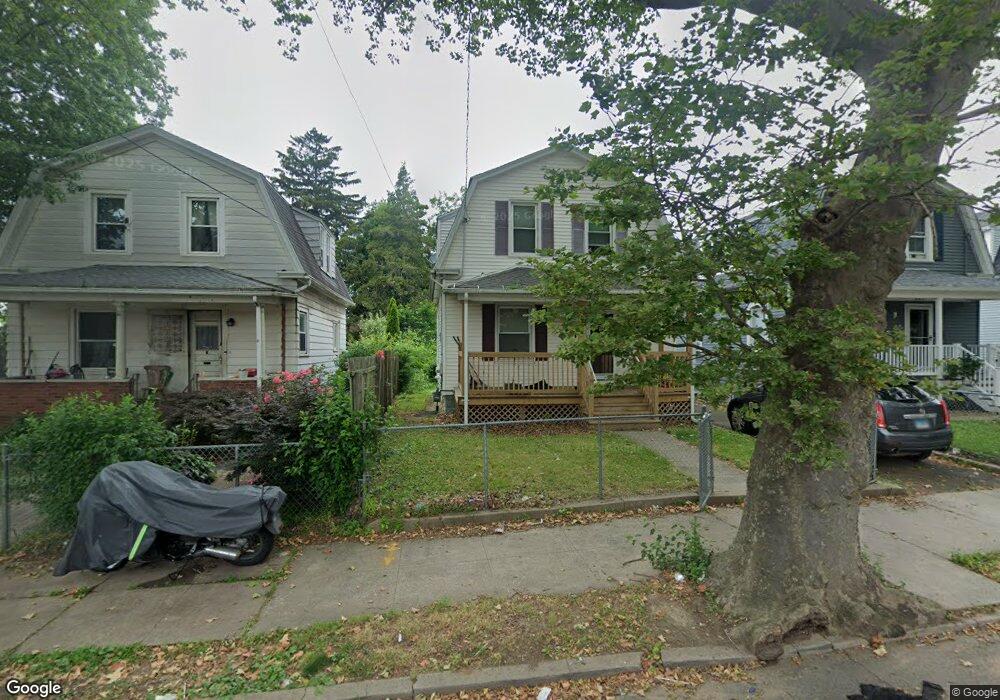
125 Truman St New Haven, CT 06519
The Hill NeighborhoodEstimated Value: $216,000 - $243,839
3
Beds
1
Bath
1,144
Sq Ft
$199/Sq Ft
Est. Value
About This Home
This home is located at 125 Truman St, New Haven, CT 06519 and is currently estimated at $227,710, approximately $199 per square foot. 125 Truman St is a home located in New Haven County with nearby schools including St Martin De Porres Academy.
Ownership History
Date
Name
Owned For
Owner Type
Purchase Details
Closed on
Jul 20, 2004
Sold by
Lopez Wenceslao
Bought by
Ricks Ester M
Current Estimated Value
Home Financials for this Owner
Home Financials are based on the most recent Mortgage that was taken out on this home.
Original Mortgage
$109,620
Interest Rate
6.25%
Purchase Details
Closed on
Mar 5, 2002
Sold by
Cartagena Miguel and Cartagena Ruth
Bought by
Lopez Wencheslao
Home Financials for this Owner
Home Financials are based on the most recent Mortgage that was taken out on this home.
Original Mortgage
$65,450
Interest Rate
6.85%
Purchase Details
Closed on
Aug 9, 1993
Sold by
Sherman George T and Sherman Ronald E
Bought by
Cartagena Miguel and Cartagena Ruth
Create a Home Valuation Report for This Property
The Home Valuation Report is an in-depth analysis detailing your home's value as well as a comparison with similar homes in the area
Home Values in the Area
Average Home Value in this Area
Purchase History
| Date | Buyer | Sale Price | Title Company |
|---|---|---|---|
| Ricks Ester M | $120,000 | -- | |
| Lopez Wencheslao | $68,900 | -- | |
| Cartagena Miguel | $24,900 | -- |
Source: Public Records
Mortgage History
| Date | Status | Borrower | Loan Amount |
|---|---|---|---|
| Open | Cartagena Miguel | $80,493 | |
| Closed | Cartagena Miguel | $20,952 | |
| Closed | Cartagena Miguel | $109,620 | |
| Previous Owner | Cartagena Miguel | $65,450 |
Source: Public Records
Tax History Compared to Growth
Tax History
| Year | Tax Paid | Tax Assessment Tax Assessment Total Assessment is a certain percentage of the fair market value that is determined by local assessors to be the total taxable value of land and additions on the property. | Land | Improvement |
|---|---|---|---|---|
| 2025 | $3,996 | $101,430 | $23,590 | $77,840 |
| 2024 | $3,905 | $101,430 | $23,590 | $77,840 |
| 2023 | $3,773 | $101,430 | $23,590 | $77,840 |
| 2022 | $4,032 | $101,430 | $23,590 | $77,840 |
| 2021 | $2,967 | $67,620 | $20,300 | $47,320 |
| 2020 | $2,967 | $67,620 | $20,300 | $47,320 |
| 2019 | $2,906 | $67,620 | $20,300 | $47,320 |
| 2018 | $2,906 | $67,620 | $20,300 | $47,320 |
| 2017 | $2,616 | $67,620 | $20,300 | $47,320 |
| 2016 | $2,350 | $56,560 | $11,620 | $44,940 |
| 2015 | $2,350 | $56,560 | $11,620 | $44,940 |
| 2014 | $2,350 | $56,560 | $11,620 | $44,940 |
Source: Public Records
Map
Nearby Homes
- 194 Ella T Grasso Blvd
- 46 Hurlburt St
- 148 Rosette St
- 45 Frank St
- 51 Arthur St
- 148 Plymouth St
- 29 White St
- 23 Dewitt St
- 133 Plymouth St
- 533 Howard Ave
- 312 Davenport Ave
- 41 Cassius St
- 82 1st St
- 72 Daggett St
- 211 Kimberly Ave
- 32 Lamberton St
- 26 Lamberton St
- 247 Davenport Ave
- 22 Thill St
- 231 Davenport Ave