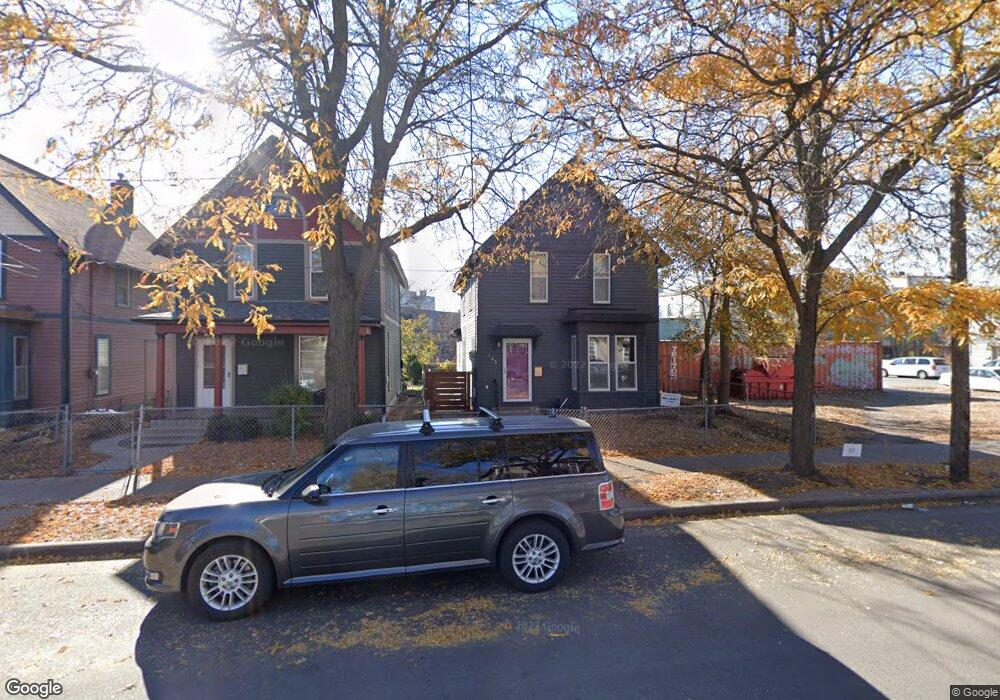
125 W 29th St Minneapolis, MN 55408
Whittier NeighborhoodEstimated Value: $219,000 - $352,000
3
Beds
2
Baths
1,266
Sq Ft
$242/Sq Ft
Est. Value
About This Home
This home is located at 125 W 29th St, Minneapolis, MN 55408 and is currently estimated at $306,141, approximately $241 per square foot. 125 W 29th St is a home located in Hennepin County with nearby schools including Whittier International, Andersen United Middle School, and South Senior High School.
Ownership History
Date
Name
Owned For
Owner Type
Purchase Details
Closed on
Mar 27, 2020
Sold by
Coley Sonia and Coley Jorge
Bought by
Coley Sonia and Coley Jorge
Current Estimated Value
Home Financials for this Owner
Home Financials are based on the most recent Mortgage that was taken out on this home.
Original Mortgage
$246,000
Outstanding Balance
$217,926
Interest Rate
3.4%
Mortgage Type
New Conventional
Estimated Equity
$88,215
Purchase Details
Closed on
Mar 30, 2018
Sold by
Archor Properties Llc
Bought by
Coley Sonia
Home Financials for this Owner
Home Financials are based on the most recent Mortgage that was taken out on this home.
Original Mortgage
$245,100
Interest Rate
4.4%
Mortgage Type
New Conventional
Purchase Details
Closed on
Jun 26, 2017
Sold by
Gross Michael J
Bought by
Anchor Properties Llc
Purchase Details
Closed on
Jan 14, 2011
Sold by
Marzitelli Patrick A and Marzitelli Susula
Bought by
Gross Michael J
Purchase Details
Closed on
Aug 28, 1997
Sold by
Themig Mark C
Bought by
Marzitelli Patrick A
Create a Home Valuation Report for This Property
The Home Valuation Report is an in-depth analysis detailing your home's value as well as a comparison with similar homes in the area
Home Values in the Area
Average Home Value in this Area
Purchase History
| Date | Buyer | Sale Price | Title Company |
|---|---|---|---|
| Coley Sonia | -- | Ancona Title And Escrow | |
| Coley Sonia | $258,000 | First American Title Co | |
| Anchor Properties Llc | -- | None Available | |
| Gross Michael J | $123,000 | -- | |
| Marzitelli Patrick A | $64,400 | -- |
Source: Public Records
Mortgage History
| Date | Status | Borrower | Loan Amount |
|---|---|---|---|
| Open | Coley Sonia | $246,000 | |
| Closed | Coley Sonia | $245,100 |
Source: Public Records
Tax History Compared to Growth
Tax History
| Year | Tax Paid | Tax Assessment Tax Assessment Total Assessment is a certain percentage of the fair market value that is determined by local assessors to be the total taxable value of land and additions on the property. | Land | Improvement |
|---|---|---|---|---|
| 2024 | $3,732 | $271,000 | $75,000 | $196,000 |
| 2023 | $3,710 | $294,000 | $79,000 | $215,000 |
| 2022 | $3,786 | $289,000 | $74,000 | $215,000 |
| 2021 | $2,973 | $275,000 | $68,000 | $207,000 |
| 2020 | $3,217 | $227,000 | $13,700 | $213,300 |
| 2019 | $2,707 | $227,000 | $12,300 | $214,700 |
| 2018 | $2,704 | $189,000 | $12,300 | $176,700 |
| 2017 | $2,625 | $170,500 | $11,200 | $159,300 |
| 2016 | $2,411 | $170,500 | $11,200 | $159,300 |
| 2015 | $2,532 | $170,500 | $11,200 | $159,300 |
| 2014 | -- | $165,500 | $11,200 | $154,300 |
Source: Public Records
Map
Nearby Homes
- 2930 Blaisdell Ave Unit 118
- 2930 Blaisdell Ave Unit 128
- 2930 Blaisdell Ave Unit 228
- 2804 Pillsbury Ave S
- 218 W 29th St
- 2940 Grand Ave S
- 104 W 27th St
- 2704 Pleasant Ave
- 2630 Blaisdell Ave
- 3022 Grand Ave S
- 2821 Garfield Ave
- 2813 Garfield Ave
- 2642 1st Ave S
- 2701 Harriet Ave Unit 200
- 2735 Garfield Ave
- 2816 Garfield Ave
- 3023 Garfield Ave
- 2724 Garfield Ave
- 2704 Garfield Ave
- 3144 Pillsbury Ave S
- 121 W 29th St
- 2905 Pillsbury Ave S
- 119 W 29th St
- 117 W 29th St
- 115 W 29th St
- 2829 Pillsbury Ave S
- 118 W 29th St
- 2825 Pillsbury Ave S
- 2900 Pillsbury Ave S
- 2906 Pillsbury Ave S
- 111 W 29th St
- 114 W 29th St
- 2830 Pillsbury Ave S
- 2824 Pillsbury Ave S
- 106 W 29th St
- 2930 2930 S Blaisdell Ave
- 2930 2930 Blaisdell-Avenue-
- 2930 2930 Blaisdell-Avenue-s
- 2930 2930 Blaisdell Ave S
- 2930 2930 Blaisdell Ave