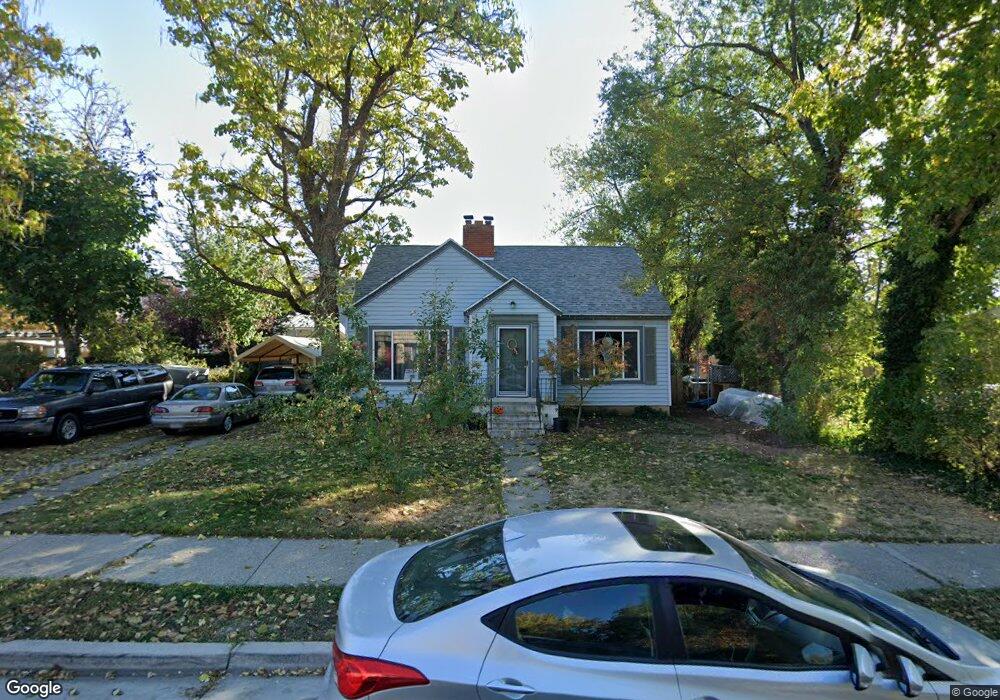
125 W 300 N Bountiful, UT 84010
Estimated Value: $413,000 - $461,784
2
Beds
1
Bath
1,958
Sq Ft
$228/Sq Ft
Est. Value
About This Home
This home is located at 125 W 300 N, Bountiful, UT 84010 and is currently estimated at $445,446, approximately $227 per square foot. 125 W 300 N is a home located in Davis County with nearby schools including Meadowbrook Elementary School, Bountiful Junior High School, and Bountiful High School.
Ownership History
Date
Name
Owned For
Owner Type
Purchase Details
Closed on
Oct 26, 2012
Sold by
Hall Cody M and Hall Melissa H
Bought by
Hall Cody Michael and Hall Melissa Horne
Current Estimated Value
Purchase Details
Closed on
Sep 3, 2002
Sold by
Hall Cody M
Bought by
Hall Cody M and Hall Melissa H
Home Financials for this Owner
Home Financials are based on the most recent Mortgage that was taken out on this home.
Original Mortgage
$112,950
Interest Rate
5.72%
Purchase Details
Closed on
Aug 29, 2002
Sold by
Sorenson Randal L
Bought by
Hall Cody M
Home Financials for this Owner
Home Financials are based on the most recent Mortgage that was taken out on this home.
Original Mortgage
$112,950
Interest Rate
5.72%
Purchase Details
Closed on
Jun 3, 1996
Sold by
Horton Chari
Bought by
Sorenson Randal L
Home Financials for this Owner
Home Financials are based on the most recent Mortgage that was taken out on this home.
Original Mortgage
$103,530
Interest Rate
7.97%
Mortgage Type
VA
Create a Home Valuation Report for This Property
The Home Valuation Report is an in-depth analysis detailing your home's value as well as a comparison with similar homes in the area
Purchase History
| Date | Buyer | Sale Price | Title Company |
|---|---|---|---|
| Hall Cody Michael | -- | None Available | |
| Hall Cody M | -- | Inwest Title Services Inc | |
| Hall Cody M | -- | Inwest Title Services Inc | |
| Sorenson Randal L | -- | First American Title Co |
Source: Public Records
Mortgage History
| Date | Status | Borrower | Loan Amount |
|---|---|---|---|
| Previous Owner | Hall Cody M | $112,950 | |
| Previous Owner | Sorenson Randal L | $103,530 |
Source: Public Records
Tax History
| Year | Tax Paid | Tax Assessment Tax Assessment Total Assessment is a certain percentage of the fair market value that is determined by local assessors to be the total taxable value of land and additions on the property. | Land | Improvement |
|---|---|---|---|---|
| 2025 | $2,483 | $227,700 | $117,913 | $109,787 |
| 2024 | $2,332 | $220,550 | $101,401 | $119,149 |
| 2023 | $2,239 | $384,000 | $190,248 | $193,752 |
| 2022 | $2,374 | $223,850 | $104,894 | $118,956 |
| 2021 | $2,048 | $294,000 | $137,117 | $156,883 |
| 2020 | $1,807 | $260,000 | $118,406 | $141,594 |
| 2019 | $1,761 | $247,000 | $134,090 | $112,910 |
| 2018 | $1,619 | $223,000 | $131,654 | $91,346 |
| 2016 | $1,426 | $106,480 | $51,912 | $54,568 |
| 2015 | $1,384 | $97,460 | $51,912 | $45,548 |
| 2014 | $1,497 | $109,306 | $51,912 | $57,394 |
| 2013 | -- | $94,503 | $39,814 | $54,689 |
Source: Public Records
Map
Nearby Homes
- 320 N 200 W Unit 4
- 332 N 300 W
- 252 N Main St
- 256 N Main St
- 254 N Main St
- 51 E 200 N Unit 3
- 55 E 200 N Unit 2
- 41 E 200 N Unit 6
- 49 E 200 N Unit 4
- 499 N 200 W Unit 30
- 75 N Peregrine Ln W Unit 8
- 563 N 200 W
- 93 W 700 N
- 106 W 700 N
- 401 W 400 N Unit 49
- 399 W 400 N Unit 47
- 290 N 500 W Unit 305
- 184 Park Shadows Cir
- 32 W 400 S
- 34 W 400 S
Your Personal Tour Guide
Ask me questions while you tour the home.