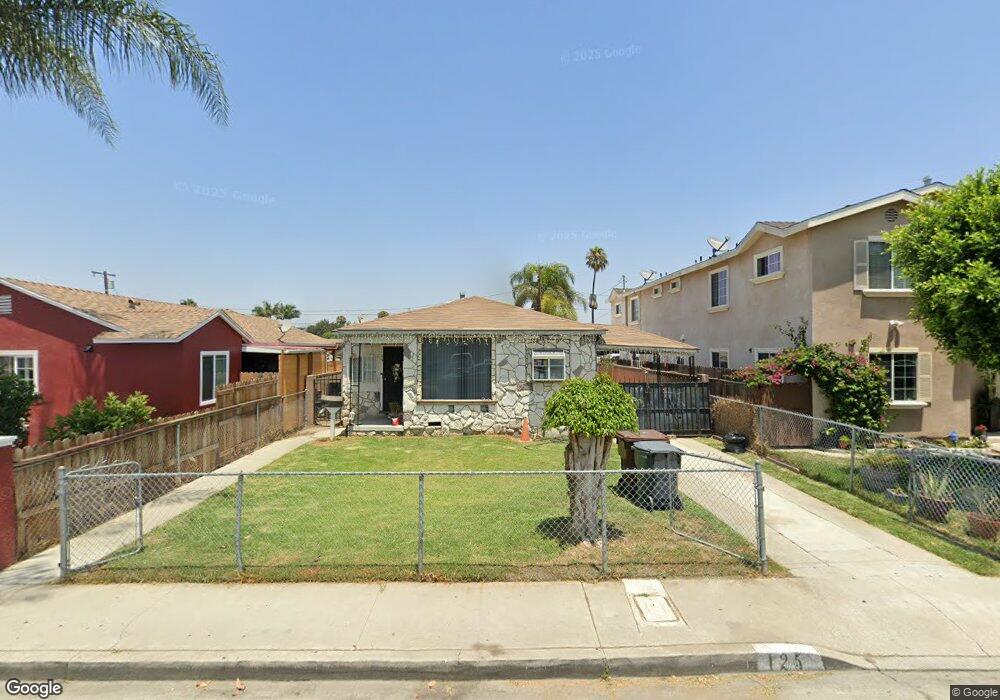
125 W Johnson St Compton, CA 90220
Estimated Value: $562,000 - $661,000
3
Beds
2
Baths
1,153
Sq Ft
$529/Sq Ft
Est. Value
About This Home
This home is located at 125 W Johnson St, Compton, CA 90220 and is currently estimated at $609,718, approximately $528 per square foot. 125 W Johnson St is a home located in Los Angeles County with nearby schools including Robert F. Kennedy Elementary School, Walton Middle School, and Compton High School.
Ownership History
Date
Name
Owned For
Owner Type
Purchase Details
Closed on
Feb 1, 2001
Sold by
Hernandez Eddie S
Bought by
Piceno Jose M and Cadengo Jaquelina
Current Estimated Value
Home Financials for this Owner
Home Financials are based on the most recent Mortgage that was taken out on this home.
Original Mortgage
$141,007
Outstanding Balance
$51,048
Interest Rate
7.11%
Mortgage Type
FHA
Estimated Equity
$558,670
Purchase Details
Closed on
May 26, 2000
Sold by
Godinez Leticia
Bought by
Hernandez Eddie S
Home Financials for this Owner
Home Financials are based on the most recent Mortgage that was taken out on this home.
Original Mortgage
$88,400
Interest Rate
8.53%
Purchase Details
Closed on
Mar 28, 2000
Sold by
Barber Juanita L
Bought by
Nationscredit Home Equity Services
Home Financials for this Owner
Home Financials are based on the most recent Mortgage that was taken out on this home.
Original Mortgage
$88,400
Interest Rate
8.53%
Create a Home Valuation Report for This Property
The Home Valuation Report is an in-depth analysis detailing your home's value as well as a comparison with similar homes in the area
Home Values in the Area
Average Home Value in this Area
Purchase History
| Date | Buyer | Sale Price | Title Company |
|---|---|---|---|
| Piceno Jose M | $143,000 | Continental Land Title | |
| Hernandez Eddie S | -- | Lawyers Title Company | |
| Hernandez Eddie S | $74,000 | Lawyers Title | |
| Nationscredit Home Equity Services | $87,900 | North American Title Co |
Source: Public Records
Mortgage History
| Date | Status | Borrower | Loan Amount |
|---|---|---|---|
| Open | Piceno Jose M | $141,007 | |
| Previous Owner | Hernandez Eddie S | $88,400 |
Source: Public Records
Tax History
| Year | Tax Paid | Tax Assessment Tax Assessment Total Assessment is a certain percentage of the fair market value that is determined by local assessors to be the total taxable value of land and additions on the property. | Land | Improvement |
|---|---|---|---|---|
| 2025 | $4,352 | $215,453 | $91,755 | $123,698 |
| 2024 | $4,352 | $211,229 | $89,956 | $121,273 |
| 2023 | $4,291 | $207,089 | $88,193 | $118,896 |
| 2022 | $3,744 | $203,029 | $86,464 | $116,565 |
| 2021 | $3,778 | $199,049 | $84,769 | $114,280 |
| 2019 | $3,673 | $193,147 | $82,255 | $110,892 |
| 2018 | $3,527 | $189,361 | $80,643 | $108,718 |
| 2016 | $3,358 | $182,010 | $77,512 | $104,498 |
| 2015 | $3,213 | $179,277 | $76,348 | $102,929 |
| 2014 | $3,159 | $175,766 | $74,853 | $100,913 |
Source: Public Records
Map
Nearby Homes
- 112 E Caldwell St
- 214 E Johnson St
- 920 S Willowbrook Ave
- 114 E Alondra Blvd
- 229 E Reeve St
- 125 E Alondra Blvd
- 512 S Willowbrook Ave
- 201 Racquet Club Dr
- 136 S Tulip Ave
- 1230 S Wilmington Ave
- 426 W Laurel St
- 623 W Indigo St
- 1540 S Pearl Ave
- 427 W Laurel St
- 1680 S Tartar Ln Unit 42
- 165 Racquet Club Dr
- 319 W Almond St
- 524 W Laurel St
- 409 W Almond St
- 435 W Almond St
- 121 W Johnson St
- 205 W Johnson St
- 207 W Johnson St
- 124 W Caldwell St
- 209 W Johnson St
- 122 W Caldwell St
- 200 W Caldwell St
- 116 W Caldwell St
- 206 W Caldwell St
- 124 W Johnson St
- 109 W Johnson St
- 200 W Johnson St
- 112 W Caldwell St
- 116 W Johnson St
- 213 W Johnson St
- 206 W Johnson St
- 208 W Caldwell St
- 208 W Johnson St
- 104 W Caldwell St
- 214 W Caldwell St
Your Personal Tour Guide
Ask me questions while you tour the home.