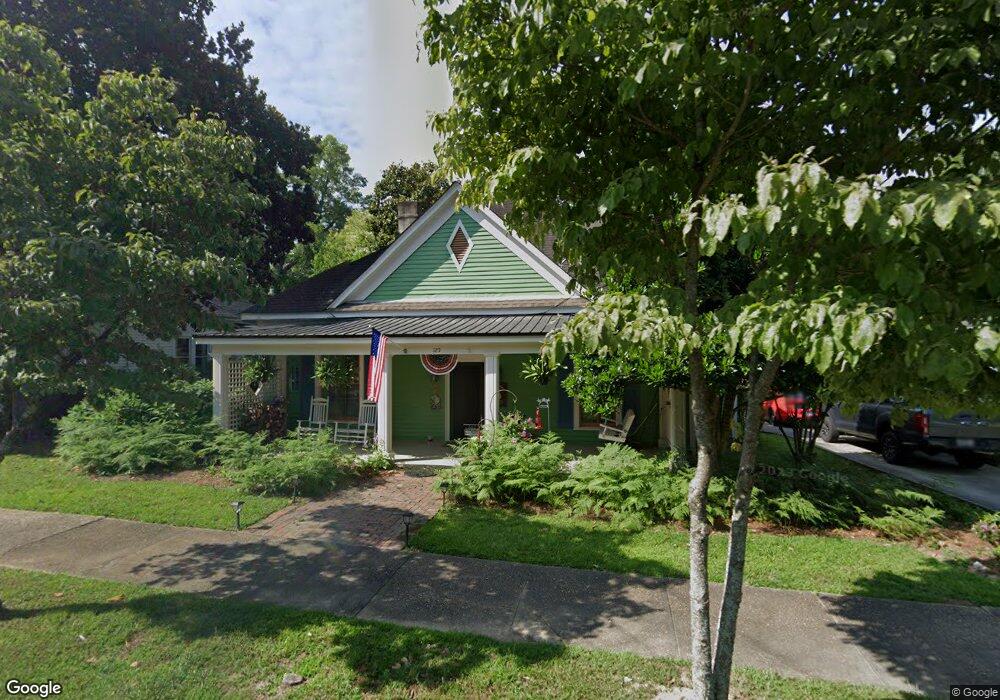
125 W Main St Rutledge, GA 30663
Estimated Value: $295,079 - $450,000
--
Bed
2
Baths
1,676
Sq Ft
$215/Sq Ft
Est. Value
About This Home
This home is located at 125 W Main St, Rutledge, GA 30663 and is currently estimated at $360,770, approximately $215 per square foot. 125 W Main St is a home located in Morgan County with nearby schools including Morgan County Primary School, Morgan County Elementary School, and Morgan County Middle School.
Ownership History
Date
Name
Owned For
Owner Type
Purchase Details
Closed on
Apr 27, 2007
Sold by
Miramonti Patricia A
Bought by
Valles William and Valles Julie
Current Estimated Value
Home Financials for this Owner
Home Financials are based on the most recent Mortgage that was taken out on this home.
Original Mortgage
$169,000
Outstanding Balance
$102,460
Interest Rate
6.11%
Mortgage Type
New Conventional
Estimated Equity
$258,310
Purchase Details
Closed on
Dec 20, 1995
Sold by
Hitchcock D L
Bought by
Miramonti Patricia E
Create a Home Valuation Report for This Property
The Home Valuation Report is an in-depth analysis detailing your home's value as well as a comparison with similar homes in the area
Home Values in the Area
Average Home Value in this Area
Purchase History
| Date | Buyer | Sale Price | Title Company |
|---|---|---|---|
| Valles William | $249,000 | -- | |
| Miramonti Patricia E | $59,500 | -- |
Source: Public Records
Mortgage History
| Date | Status | Borrower | Loan Amount |
|---|---|---|---|
| Open | Valles William | $169,000 |
Source: Public Records
Tax History Compared to Growth
Tax History
| Year | Tax Paid | Tax Assessment Tax Assessment Total Assessment is a certain percentage of the fair market value that is determined by local assessors to be the total taxable value of land and additions on the property. | Land | Improvement |
|---|---|---|---|---|
| 2024 | $2,640 | $104,078 | $15,200 | $88,878 |
| 2023 | $2,490 | $95,350 | $13,600 | $81,750 |
| 2022 | $2,215 | $81,865 | $13,600 | $68,265 |
| 2021 | $1,987 | $73,292 | $8,000 | $65,292 |
| 2020 | $1,950 | $71,292 | $6,000 | $65,292 |
| 2019 | $1,980 | $71,292 | $6,000 | $65,292 |
| 2018 | $2,006 | $71,219 | $6,000 | $65,219 |
| 2017 | $2,067 | $70,530 | $6,000 | $64,530 |
| 2016 | $1,838 | $62,823 | $6,000 | $56,823 |
| 2015 | $1,814 | $61,176 | $4,000 | $57,176 |
| 2014 | $1,476 | $51,280 | $4,000 | $47,280 |
| 2013 | -- | $41,416 | $4,000 | $37,416 |
Source: Public Records
Map
Nearby Homes
- 224 Hollis St
- 5761B W Dixie Hwy
- 306 W Main St
- 0 Hawkins Academy Rd Unit 10561655
- 5761 W Dixie Hwy
- 5521 Atlanta Hwy
- 5761B Dixie Hwy
- 1971 Centennial Rd
- 1051 Lake Rutledge Rd
- 2070 Walter Shepherd Rd
- 1310 Chilton Woods Rd
- 0 W Dixie Hwy Unit 10499573
- 1151 Fears Rd
- 1120 Rawlings Dr
- 4350 Atlanta Hwy
- 5187 Parkview Rd