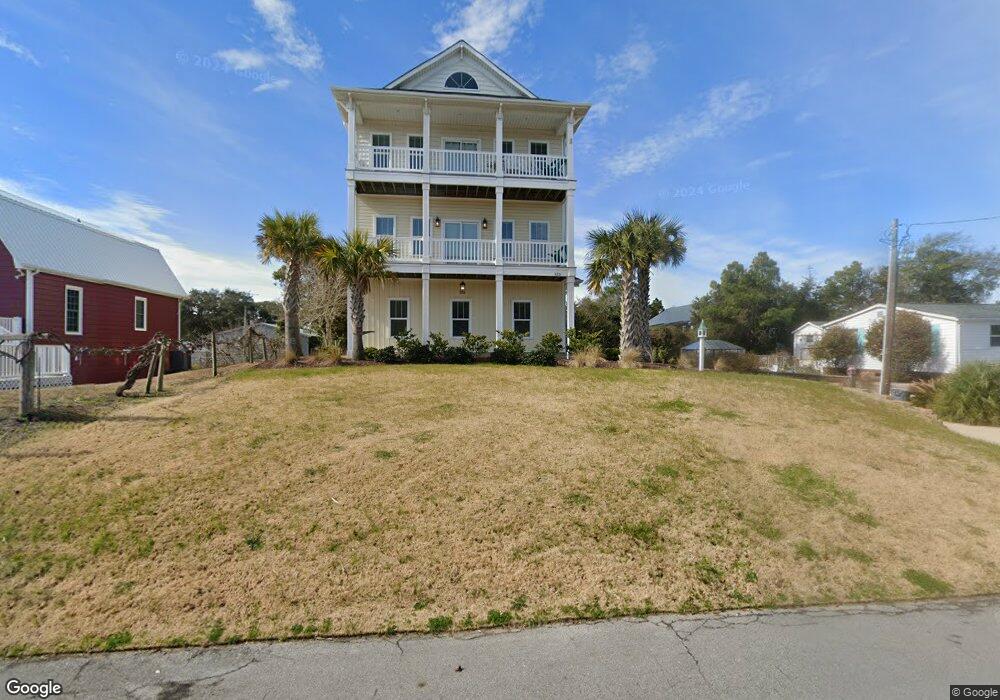
125 W Sea View Dr Emerald Isle, NC 28594
Estimated Value: $1,150,000 - $1,478,000
3
Beds
4
Baths
3,210
Sq Ft
$406/Sq Ft
Est. Value
About This Home
This home is located at 125 W Sea View Dr, Emerald Isle, NC 28594 and is currently estimated at $1,303,032, approximately $405 per square foot. 125 W Sea View Dr is a home located in Carteret County with nearby schools including White Oak Elementary School, Broad Creek Middle School, and Croatan High School.
Ownership History
Date
Name
Owned For
Owner Type
Purchase Details
Closed on
Sep 12, 2025
Sold by
Stallings Krystle Nelson and Rogister Robert Earl
Bought by
Rogister Robert Earl and Rogister Krystle Nelson
Current Estimated Value
Home Financials for this Owner
Home Financials are based on the most recent Mortgage that was taken out on this home.
Original Mortgage
$782,700
Outstanding Balance
$782,700
Interest Rate
6.63%
Mortgage Type
New Conventional
Estimated Equity
$520,332
Purchase Details
Closed on
Feb 5, 2024
Sold by
Pmj Holdings Ii Llc
Bought by
Rogister Robert Earl and Stallings Krystle Nelson
Home Financials for this Owner
Home Financials are based on the most recent Mortgage that was taken out on this home.
Original Mortgage
$766,550
Interest Rate
6.62%
Mortgage Type
New Conventional
Purchase Details
Closed on
Feb 11, 2022
Sold by
Larry T Pendleton Revocable Trust
Bought by
Pmj Holdings Ii Llc
Purchase Details
Closed on
Mar 24, 2021
Sold by
Pendleton Larry T and Pendleton Tommie R
Bought by
Pendleton Larry T and Larry T Pendleton Revocable Tr
Purchase Details
Closed on
Jul 31, 2020
Sold by
Kitchen Kraft Inc
Bought by
Pendleton Larry T
Purchase Details
Closed on
Aug 18, 2017
Sold by
Hamilton Kay O and Hamilton Jesse L
Bought by
Richen Graft Inc
Create a Home Valuation Report for This Property
The Home Valuation Report is an in-depth analysis detailing your home's value as well as a comparison with similar homes in the area
Home Values in the Area
Average Home Value in this Area
Purchase History
| Date | Buyer | Sale Price | Title Company |
|---|---|---|---|
| Rogister Robert Earl | -- | None Listed On Document | |
| Rogister Robert Earl | $1,100,000 | None Listed On Document | |
| Pmj Holdings Ii Llc | $912,000 | Parker Julie A | |
| Pendleton Larry T | -- | None Available | |
| Pendleton Larry T | -- | None Available | |
| Pendleton Larry T | $550,000 | None Available | |
| Richen Graft Inc | $165,000 | None Available |
Source: Public Records
Mortgage History
| Date | Status | Borrower | Loan Amount |
|---|---|---|---|
| Open | Rogister Robert Earl | $782,700 | |
| Previous Owner | Rogister Robert Earl | $766,550 |
Source: Public Records
Tax History Compared to Growth
Tax History
| Year | Tax Paid | Tax Assessment Tax Assessment Total Assessment is a certain percentage of the fair market value that is determined by local assessors to be the total taxable value of land and additions on the property. | Land | Improvement |
|---|---|---|---|---|
| 2025 | $4,504 | $1,233,681 | $356,320 | $877,361 |
| 2024 | $3,427 | $599,716 | $165,375 | $434,341 |
| 2023 | $3,189 | $599,716 | $165,375 | $434,341 |
| 2022 | $3,259 | $599,716 | $165,375 | $434,341 |
| 2021 | $1,594 | $599,716 | $165,375 | $434,341 |
| 2020 | $3,179 | $599,716 | $165,375 | $434,341 |
| 2019 | $1,861 | $595,365 | $159,862 | $435,503 |
| 2017 | $511 | $159,862 | $159,862 | $0 |
| 2016 | $511 | $159,862 | $159,862 | $0 |
| 2015 | $495 | $159,862 | $159,862 | $0 |
| 2014 | -- | $185,036 | $185,036 | $0 |
Source: Public Records
Map
Nearby Homes
- 8520 Reed Dr Unit A
- 8520 Reed Dr Unit B
- 105 Bayberry Dr
- 120 Shorerush Dr
- 8410 Canal Dr
- 315 Bogue Inlet Dr
- 127 Eastview Dr
- 123 Sandbur Dr
- 8626 Reed Dr
- 311 Hancock Dr
- 309 Lamroc Dr
- 204 Holly St
- 314 Parkin Dr
- 412 Wild Cherry Ln
- 320 Baytree Ln
- 108 Live Oak St
- 424 Emerald Cir
- 8722 Emerald Plantation Rd
- 8801 Reed Dr Unit 512
- 8801 Reed Dr Unit 311
- 125 W Seaview Dr
- 125 Sea View W
- 125 W Sea View Dr
- 8505 Reed Dr
- 122 Sea Oats Dr
- 116 W Seaview Dr
- 8100 Reed Dr Unit 416
- 120 Sea Oats Dr
- 123 Sea Oats Dr
- 125 Sea Oats Dr
- 119 Sea Oats Dr
- 8510 Reed Dr
- 121 E Seaview Dr
- 119 E Sea View Dr
- 123 W Seaview Dr
- 118 Sea Oats Dr
- 117 W Sea View Dr
- 117 E Seaview Dr
- 117 Sea Oats Dr
- 122 Myrtle St