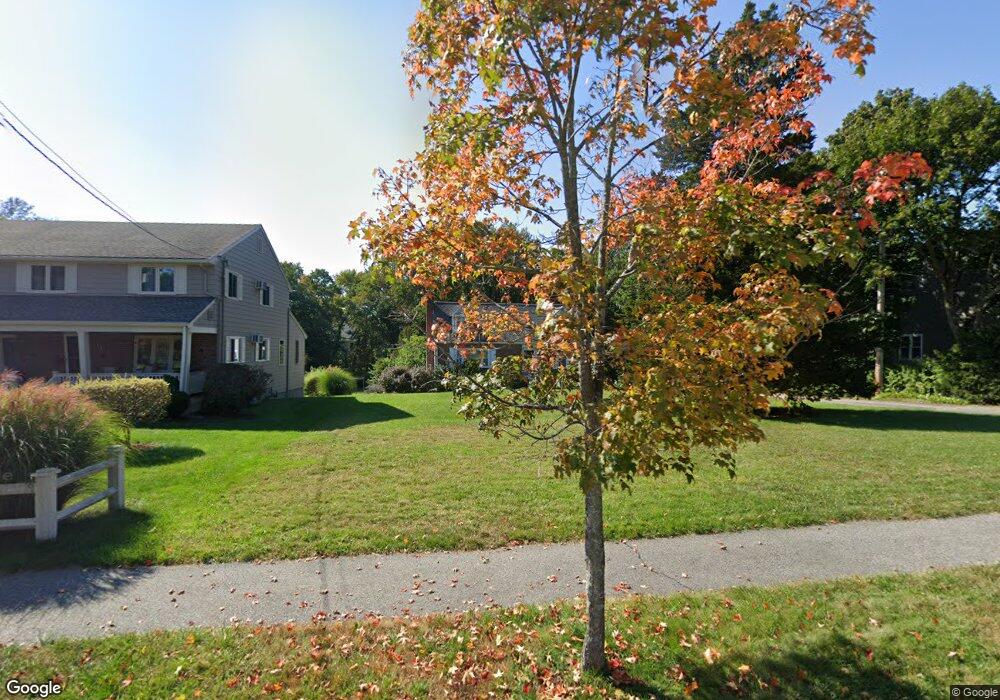
125 Webster St Needham Heights, MA 02494
Estimated Value: $1,238,000 - $1,458,000
3
Beds
2
Baths
1,637
Sq Ft
$799/Sq Ft
Est. Value
About This Home
This home is located at 125 Webster St, Needham Heights, MA 02494 and is currently estimated at $1,308,465, approximately $799 per square foot. 125 Webster St is a home located in Norfolk County with nearby schools including Eliot Elementary School, High Rock Middle School, and Pollard Middle School.
Ownership History
Date
Name
Owned For
Owner Type
Purchase Details
Closed on
Sep 26, 2008
Sold by
Forte Barbara
Bought by
Hill Carla S and Hill Michael A
Current Estimated Value
Home Financials for this Owner
Home Financials are based on the most recent Mortgage that was taken out on this home.
Original Mortgage
$290,000
Interest Rate
6.57%
Mortgage Type
Purchase Money Mortgage
Purchase Details
Closed on
May 15, 1998
Sold by
Ilmonen Bruno P and Ilmonen Janet E
Bought by
Forte Barbara
Create a Home Valuation Report for This Property
The Home Valuation Report is an in-depth analysis detailing your home's value as well as a comparison with similar homes in the area
Home Values in the Area
Average Home Value in this Area
Purchase History
| Date | Buyer | Sale Price | Title Company |
|---|---|---|---|
| Hill Carla S | $589,700 | -- | |
| Hill Carla S | $589,700 | -- | |
| Forte Barbara | $307,500 | -- | |
| Forte Barbara | $307,500 | -- |
Source: Public Records
Mortgage History
| Date | Status | Borrower | Loan Amount |
|---|---|---|---|
| Open | Forte Barbara | $276,000 | |
| Closed | Forte Barbara | $287,000 | |
| Closed | Hill Carla S | $290,000 |
Source: Public Records
Tax History
| Year | Tax Paid | Tax Assessment Tax Assessment Total Assessment is a certain percentage of the fair market value that is determined by local assessors to be the total taxable value of land and additions on the property. | Land | Improvement |
|---|---|---|---|---|
| 2025 | $11,029 | $1,040,500 | $769,000 | $271,500 |
| 2024 | $10,437 | $833,600 | $497,500 | $336,100 |
| 2023 | $10,587 | $811,900 | $497,500 | $314,400 |
| 2022 | $10,036 | $750,600 | $446,000 | $304,600 |
| 2021 | $9,780 | $750,600 | $446,000 | $304,600 |
| 2020 | $9,264 | $741,700 | $446,000 | $295,700 |
| 2019 | $8,673 | $700,000 | $407,000 | $293,000 |
| 2018 | $8,316 | $700,000 | $407,000 | $293,000 |
| 2017 | $7,913 | $665,500 | $407,000 | $258,500 |
| 2016 | $7,522 | $651,800 | $407,000 | $244,800 |
| 2015 | $7,359 | $651,800 | $407,000 | $244,800 |
| 2014 | $6,548 | $562,500 | $342,000 | $220,500 |
Source: Public Records
Map
Nearby Homes
- 62 Evelyn Rd
- 74 Gary Rd
- 345 Central Ave
- 248 Webster St Unit 248
- 443 Central Ave
- 212 Central Ave
- 12 Hill St
- 140 Hillside Ave
- 140 Hillside Ave Unit a
- 132 Hillside Ave
- 400 Hunnewell St Unit 103
- 379 Hunnewell St Unit 379
- 108 Woodbine Cir
- 5 Hazel Ln
- 5 Homsy Ln
- 18 Evergreen Rd
- 40 High St
- 3 Crescent Rd
- 143 Hunting Rd
- 310 Oakland St