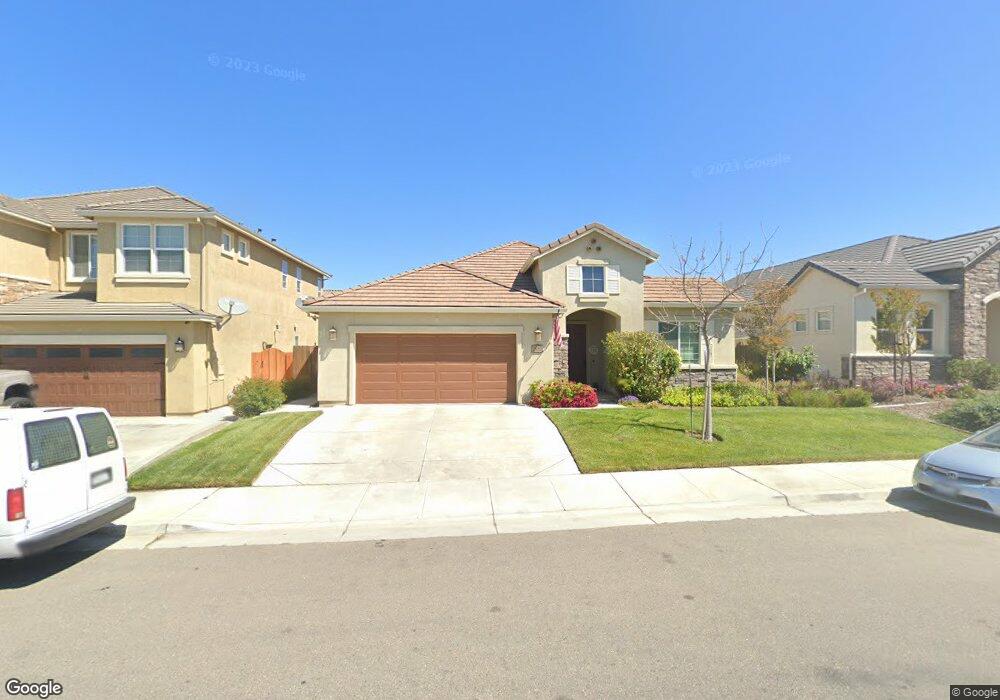
1250 Brigantino Dr Hollister, CA 95023
Estimated Value: $748,230 - $928,000
4
Beds
2
Baths
2,010
Sq Ft
$397/Sq Ft
Est. Value
About This Home
This home is located at 1250 Brigantino Dr, Hollister, CA 95023 and is currently estimated at $797,058, approximately $396 per square foot. 1250 Brigantino Dr is a home located in San Benito County with nearby schools including Gabilan Hills School, Maze Middle School, and San Benito High School.
Ownership History
Date
Name
Owned For
Owner Type
Purchase Details
Closed on
May 10, 2023
Sold by
Robert E And Catherine M Brown Living Tr and Brown Robert Edgar
Bought by
Robert E And Catherine M Brown Living Trust and Brown
Current Estimated Value
Home Financials for this Owner
Home Financials are based on the most recent Mortgage that was taken out on this home.
Original Mortgage
$1,117,500
Outstanding Balance
$1,075,597
Interest Rate
4.7%
Mortgage Type
Reverse Mortgage Home Equity Conversion Mortgage
Estimated Equity
-$278,539
Purchase Details
Closed on
Sep 6, 2012
Sold by
Brown Robert E and Brown Catherine M
Bought by
The Robert E & Catherine M Brown Living
Purchase Details
Closed on
Dec 14, 2011
Sold by
Lodi Development Inc
Bought by
Brown Robert E and Brown Catherine M
Create a Home Valuation Report for This Property
The Home Valuation Report is an in-depth analysis detailing your home's value as well as a comparison with similar homes in the area
Home Values in the Area
Average Home Value in this Area
Purchase History
| Date | Buyer | Sale Price | Title Company |
|---|---|---|---|
| Robert E And Catherine M Brown Living Trust | -- | Fnc Title Of California | |
| The Robert E & Catherine M Brown Living | -- | None Available | |
| Brown Robert E | $395,000 | First American Title Company |
Source: Public Records
Mortgage History
| Date | Status | Borrower | Loan Amount |
|---|---|---|---|
| Open | Robert E And Catherine M Brown Living Trust | $1,117,500 | |
| Closed | Robert E And Catherine M Brown Living Trust | $1,117,500 |
Source: Public Records
Tax History Compared to Growth
Tax History
| Year | Tax Paid | Tax Assessment Tax Assessment Total Assessment is a certain percentage of the fair market value that is determined by local assessors to be the total taxable value of land and additions on the property. | Land | Improvement |
|---|---|---|---|---|
| 2025 | $6,421 | $496,130 | $156,999 | $339,131 |
| 2023 | $6,421 | $476,866 | $150,903 | $325,963 |
| 2022 | $6,177 | $467,517 | $147,945 | $319,572 |
| 2021 | $6,074 | $458,351 | $145,045 | $313,306 |
| 2020 | $6,013 | $453,652 | $143,558 | $310,094 |
| 2019 | $5,915 | $444,758 | $140,744 | $304,014 |
| 2018 | $5,784 | $436,038 | $137,985 | $298,053 |
| 2017 | $5,697 | $427,489 | $135,280 | $292,209 |
| 2016 | $5,621 | $419,108 | $132,628 | $286,480 |
| 2015 | $5,487 | $412,813 | $130,636 | $282,177 |
| 2014 | $5,187 | $404,728 | $128,078 | $276,650 |
Source: Public Records
Map
Nearby Homes
- 1330 Brigantino Dr
- 1330 Meridian St
- Plan 5 at Willow Landing
- Plan 1 at Willow Landing
- Plan 2 at Willow Landing
- Plan 6 at Willow Landing
- Plan 4 at Willow Landing
- 151 Dogwood Ct
- 130 Dogwood Ct
- 102 Dogwood Ct
- 104 Dogwood Ct
- 110 Dogwood Ct
- 950 Peach Ct
- 471 Segovia Dr
- 1591 Hillcrest Rd
- 971 Cherry St
- 931 Hillcrest Rd
- 791 El Camino Paraiso
- 751 La Baig Dr
- 930 Bonnie View Dr
- 1240 Brigantino Dr
- 1260 Brigantino Dr
- 1151 Cabrillo Dr
- 1141 Cabrillo Dr
- 1230 Brigantino Dr
- 1270 Brigantino Dr
- 1161 Cabrillo Dr
- 1131 Cabrillo Dr
- 1171 Cabrillo Dr
- 1281 Brigantino Dr
- 1261 Brigantino Dr
- 1121 Cabrillo Dr
- 1220 Brigantino Dr
- 1280 Brigantino Dr
- 1301 Brigantino Dr
- 1241 Brigantino Dr
- 1181 Cabrillo Dr
- 1111 Cabrillo Dr
- 1305 Brigantino Dr
- 1221 Brigantino Dr