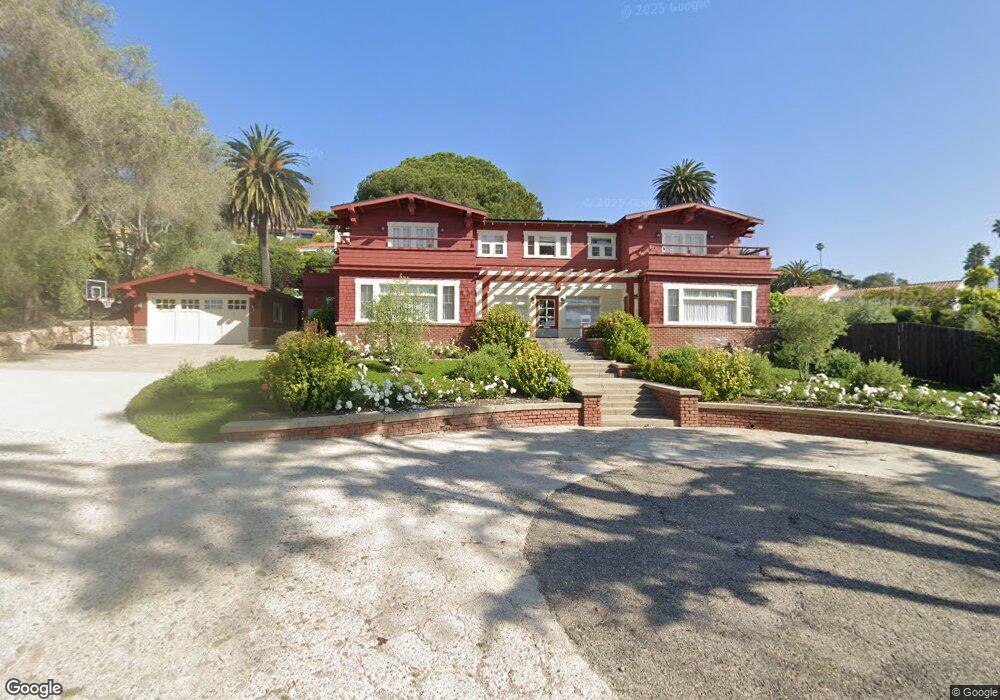
1250 Cliff Dr Unit A Santa Barbara, CA 93109
Alta Mesa NeighborhoodEstimated Value: $4,852,000 - $6,126,000
6
Beds
6
Baths
4,218
Sq Ft
$1,315/Sq Ft
Est. Value
About This Home
This home is located at 1250 Cliff Dr Unit A, Santa Barbara, CA 93109 and is currently estimated at $5,546,477, approximately $1,314 per square foot. 1250 Cliff Dr Unit A is a home located in Santa Barbara County with nearby schools including Washington Elementary School, La Cumbre Junior High School, and Olive Grove Charter - Santa Barbara.
Ownership History
Date
Name
Owned For
Owner Type
Purchase Details
Closed on
Mar 28, 2017
Sold by
Coyote Developers Llc
Bought by
Parris William S and Parris Kamala K
Current Estimated Value
Purchase Details
Closed on
Mar 25, 2016
Sold by
Boyd Lance D and Boyd Judith A
Bought by
Coyote Developers Llc
Purchase Details
Closed on
Sep 25, 2015
Sold by
Coryell Dorothy and Coryell Mary Dorothea
Bought by
Boyd Judith Anne
Purchase Details
Closed on
Oct 15, 2012
Sold by
Boyd Lance D and Boyd Judith A
Bought by
Boyd Lance D and Boyd Judith A
Purchase Details
Closed on
May 18, 2012
Sold by
Coryell Dorothy and Coryell Mary Dorothea
Bought by
Boyd Judith Anne and Gabel Davdi Goodrich
Purchase Details
Closed on
Jun 18, 2008
Sold by
Boyd Judith Anne
Bought by
Boyd Judith Anne
Purchase Details
Closed on
Apr 30, 1999
Sold by
Coryell Mary Dorothea and Gabel Mary Dorothea
Bought by
Coryell Noble Burr and Coryell Mary Dorothea
Create a Home Valuation Report for This Property
The Home Valuation Report is an in-depth analysis detailing your home's value as well as a comparison with similar homes in the area
Home Values in the Area
Average Home Value in this Area
Purchase History
| Date | Buyer | Sale Price | Title Company |
|---|---|---|---|
| Parris William S | -- | None Available | |
| Coyote Developers Llc | $2,750,000 | First American Title Company | |
| Boyd Judith Anne | -- | First American Title Company | |
| Boyd Lance D | -- | None Available | |
| Boyd Lance D | -- | None Available | |
| Boyd Judith A | -- | None Available | |
| Boyd Judith Anne | -- | None Available | |
| Coryell Dorothy | -- | None Available | |
| Boyd Judith Anne | -- | None Available | |
| Coryell Noble Burr | -- | -- |
Source: Public Records
Tax History Compared to Growth
Tax History
| Year | Tax Paid | Tax Assessment Tax Assessment Total Assessment is a certain percentage of the fair market value that is determined by local assessors to be the total taxable value of land and additions on the property. | Land | Improvement |
|---|---|---|---|---|
| 2025 | $37,441 | $3,608,267 | $2,495,257 | $1,113,010 |
| 2023 | $37,441 | $3,201,506 | $2,398,364 | $803,142 |
| 2022 | $33,407 | $3,143,282 | $2,351,338 | $791,944 |
| 2021 | $31,234 | $2,948,554 | $2,305,234 | $643,320 |
| 2020 | $30,913 | $2,918,321 | $2,281,597 | $636,724 |
| 2019 | $30,375 | $2,861,100 | $2,236,860 | $624,240 |
| 2018 | $29,946 | $2,805,000 | $2,193,000 | $612,000 |
| 2017 | $28,957 | $2,750,000 | $2,150,000 | $600,000 |
| 2016 | $1,738 | $153,847 | $57,237 | $96,610 |
| 2014 | $1,693 | $148,569 | $55,274 | $93,295 |
Source: Public Records
Map
Nearby Homes
- 410 Terrace Rd
- 421 Vista de la Playa Ln
- 1274 San Miguel Ave
- 232 Las Ondas
- 543.5 Arroyo Ave
- 1429 Shoreline Dr
- 540 Miramonte Dr
- 343 Salida Del Sol
- 986 Miramonte Dr Unit 6
- 245 Cordova Dr
- 860 Miramonte Dr
- 1749 La Coronilla Dr
- 1809 Cliff Dr Unit 3
- 421 Coronel St
- 231 Salida Del Sol
- 325 Ladera St Unit 5
- 222 Meigs Rd
- 521 W Montecito St Unit 4
- 912 San Andres St
- 1121 Chino St Unit 5
- 1250 Cliff Dr Unit B
- 1250 Cliff Dr
- 411 Vista de la Playa Ln
- 414 Terrace Rd
- 420 Terrace Rd
- 415 Vista de la Playa Ln
- 0000 Vista de la Playa
- 424 Terrace Rd
- 1246 Cliff Dr
- 1266 Cliff Dr
- 431 Vista de la Playa Ln
- 407 Vista de la Playa Ln
- 430 Terrace Rd
- 1236 Cliff Dr
- 435 Vista de la Playa Ln
- 404 Terrace Rd
- 404 Terrace Dr
- 427 Vista de la Playa Ln
- 434 Terrace Rd
- 411 Terrace Dr