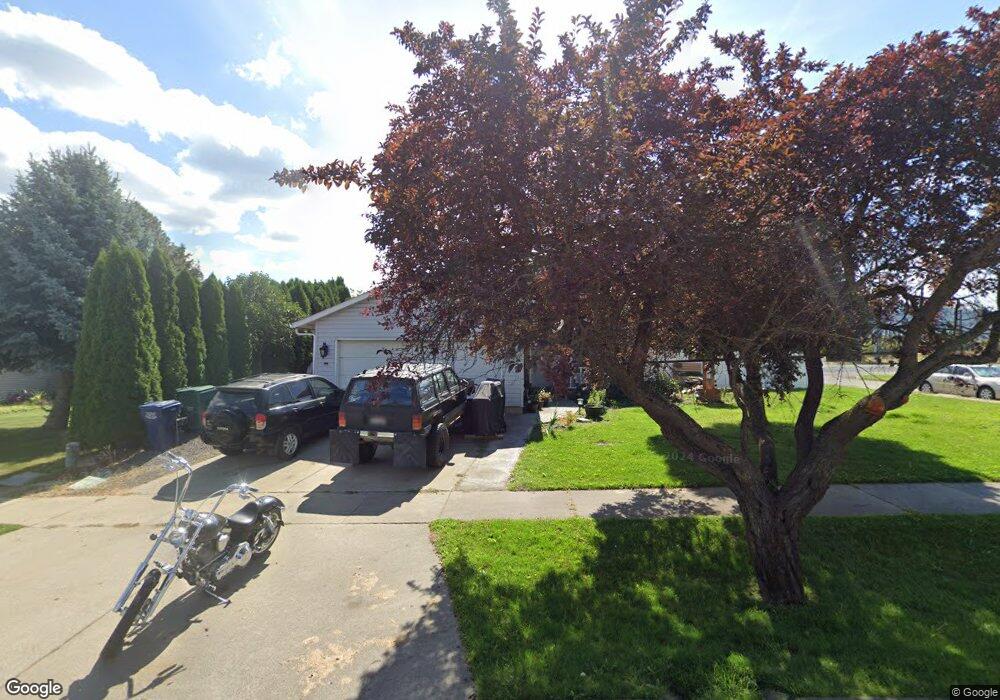
1250 E Stetson Ave Post Falls, ID 83854
Central Post Falls NeighborhoodEstimated Value: $429,000 - $448,000
3
Beds
2
Baths
1,440
Sq Ft
$305/Sq Ft
Est. Value
About This Home
This home is located at 1250 E Stetson Ave, Post Falls, ID 83854 and is currently estimated at $439,108, approximately $304 per square foot. 1250 E Stetson Ave is a home located in Kootenai County with nearby schools including Prairie View Elementary School, Post Falls Middle School, and Post Falls High School.
Ownership History
Date
Name
Owned For
Owner Type
Purchase Details
Closed on
Feb 3, 2025
Sold by
Quigley Jennifer Lynn
Bought by
Reno Anthony M
Current Estimated Value
Purchase Details
Closed on
Aug 26, 2021
Sold by
Makuch Rodney
Bought by
Reno Anthony M and Quigley Jennifer Lynn
Home Financials for this Owner
Home Financials are based on the most recent Mortgage that was taken out on this home.
Original Mortgage
$351,625
Interest Rate
2.8%
Mortgage Type
New Conventional
Purchase Details
Closed on
Aug 19, 2015
Sold by
Mckillip Derrick A and Mckillip Wendy M
Bought by
Williams Sara E and Williams Kyle J
Home Financials for this Owner
Home Financials are based on the most recent Mortgage that was taken out on this home.
Original Mortgage
$5,130
Interest Rate
3.97%
Mortgage Type
Second Mortgage Made To Cover Down Payment
Purchase Details
Closed on
Nov 8, 2011
Sold by
Mckillip Derrick A and Mckillip Vendy M
Bought by
Mckillip Derrick A and Mckillip Wendy M
Create a Home Valuation Report for This Property
The Home Valuation Report is an in-depth analysis detailing your home's value as well as a comparison with similar homes in the area
Home Values in the Area
Average Home Value in this Area
Purchase History
| Date | Buyer | Sale Price | Title Company |
|---|---|---|---|
| Reno Anthony M | -- | None Listed On Document | |
| Reno Anthony M | -- | Poineer Title Kootenai Cnty | |
| Williams Sara E | -- | None Available | |
| Mckillip Derrick A | -- | Alliance Title |
Source: Public Records
Mortgage History
| Date | Status | Borrower | Loan Amount |
|---|---|---|---|
| Previous Owner | Reno Anthony M | $351,625 | |
| Previous Owner | Williams Sara E | $5,130 | |
| Previous Owner | Williams Sara E | $167,902 |
Source: Public Records
Tax History
| Year | Tax Paid | Tax Assessment Tax Assessment Total Assessment is a certain percentage of the fair market value that is determined by local assessors to be the total taxable value of land and additions on the property. | Land | Improvement |
|---|---|---|---|---|
| 2025 | $1,424 | $384,040 | $165,000 | $219,040 |
| 2024 | $1,417 | $374,650 | $155,250 | $219,400 |
| 2023 | $1,417 | $391,900 | $172,500 | $219,400 |
| 2022 | $1,903 | $429,199 | $172,500 | $256,699 |
| 2021 | $1,567 | $275,950 | $115,000 | $160,950 |
| 2020 | $1,575 | $234,450 | $90,000 | $144,450 |
| 2019 | $1,509 | $215,940 | $80,000 | $135,940 |
| 2018 | $1,368 | $189,260 | $65,000 | $124,260 |
| 2017 | $1,337 | $169,370 | $48,000 | $121,370 |
| 2016 | $1,297 | $155,110 | $40,000 | $115,110 |
| 2015 | $2,172 | $132,220 | $34,000 | $98,220 |
| 2013 | $1,108 | $119,300 | $31,500 | $87,800 |
Source: Public Records
Map
Nearby Homes
- 1255 E Stetson Ave
- 1245 E Stetson Ave
- 1180 E Mullan Ave
- 1251 E Polston Ave
- 634 N Calgary Ct
- 1163 E Polston Ave
- 1019 N Nellie Ct
- 900 N Idaho St Unit 107
- 1016 E Healy Ave
- 936 E Healy
- 982 E Healy Ave
- 987 E Healy Ave
- 1090 E 4th Ave
- 993 E Railroad Ave
- 1037 E Railroad Ave
- 1035 E Railroad Ave
- 1031 E Railroad Ave
- 995 E Railroad Ave
- 953 E Railroad Ave
- 1544 N McKelvy Ln
- 1260 E Stetson Ave
- 0 Stetson Ave
- 1270 E Stetson Ave
- 1230 E Stetson Ave
- 850 N Fulton St
- 1235 Stetson Ave
- 865 N Fulton St
- 1220 E Stetson Ave
- 860 N Fulton St
- 1225 E Stetson Ave
- 875 N Fulton St
- 870 N Fulton St
- Lt 3 Blk 1 Shetland St
- 0 Shetland St
- 1331 E Mullan Ave
- 870 N Cimmaron St
- 1210 E Stetson Ave
- 880 N Fulton St
- 845 Cimmaron St
- 885 N Fulton St
Your Personal Tour Guide
Ask me questions while you tour the home.