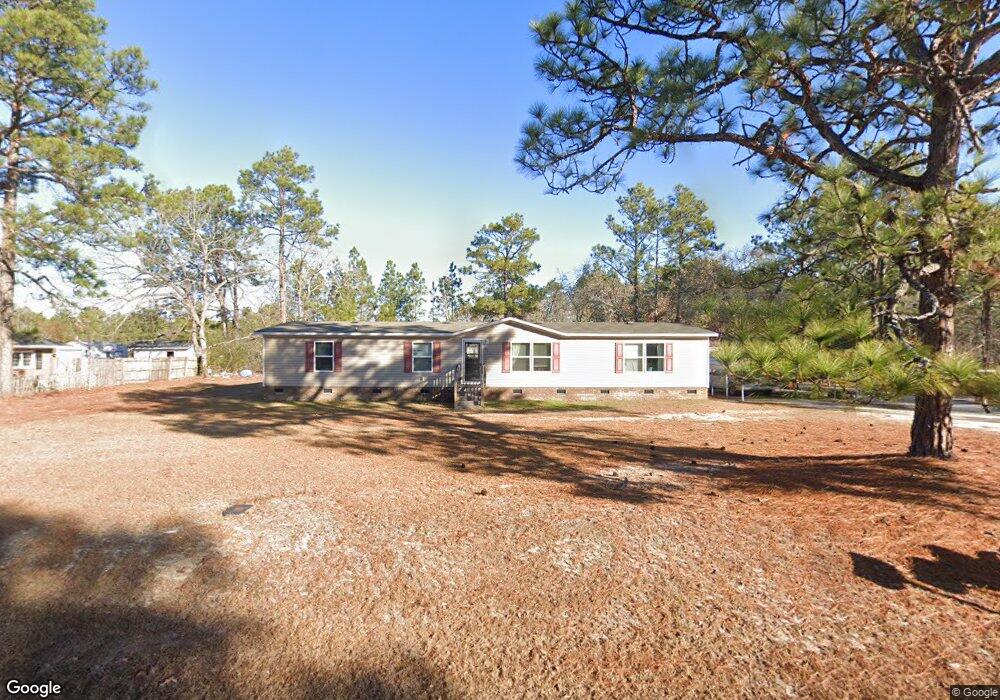
1250 Loop Rd Raeford, NC 28376
Estimated Value: $163,000 - $202,000
Studio
2
Baths
1,836
Sq Ft
$96/Sq Ft
Est. Value
About This Home
This home is located at 1250 Loop Rd, Raeford, NC 28376 and is currently estimated at $176,333, approximately $96 per square foot. 1250 Loop Rd is a home located in Hoke County with nearby schools including West Hoke Elementary School, West Hoke Middle, and Hoke County High.
Ownership History
Date
Name
Owned For
Owner Type
Purchase Details
Closed on
Mar 10, 2020
Sold by
Blue Charles E and Blue Charles E
Bought by
Blue Ellen Baldwin
Current Estimated Value
Purchase Details
Closed on
Nov 13, 2017
Sold by
Blue Charles
Bought by
Blue Ellen
Create a Home Valuation Report for This Property
The Home Valuation Report is an in-depth analysis detailing your home's value as well as a comparison with similar homes in the area
Home Values in the Area
Average Home Value in this Area
Purchase History
| Date | Buyer | Sale Price | Title Company |
|---|---|---|---|
| Blue Ellen Baldwin | -- | None Available | |
| Blue Ellen | -- | None Available |
Source: Public Records
Tax History
| Year | Tax Paid | Tax Assessment Tax Assessment Total Assessment is a certain percentage of the fair market value that is determined by local assessors to be the total taxable value of land and additions on the property. | Land | Improvement |
|---|---|---|---|---|
| 2025 | $1,110 | $118,130 | $15,000 | $103,130 |
| 2024 | $1,110 | $118,130 | $15,000 | $103,130 |
| 2023 | $1,110 | $118,130 | $15,000 | $103,130 |
| 2022 | $1,079 | $118,130 | $15,000 | $103,130 |
| 2021 | $769 | $77,590 | $6,750 | $70,840 |
| 2020 | $297 | $20,080 | $6,750 | $13,330 |
| 2019 | $297 | $20,080 | $6,750 | $13,330 |
| 2018 | $297 | $20,080 | $6,750 | $13,330 |
| 2017 | $297 | $20,080 | $6,750 | $13,330 |
| 2016 | $293 | $20,080 | $6,750 | $13,330 |
| 2015 | $293 | $20,080 | $6,750 | $13,330 |
| 2014 | $275 | $20,080 | $6,750 | $13,330 |
| 2013 | -- | $23,980 | $5,630 | $18,350 |
Source: Public Records
Map
Nearby Homes
- TBD Pine Lake Dr
- 0 Kendrick Rd
- 2908 Calloway Rd
- 461 Lally Cir
- 349 Lally Cir
- 0 Us 15 501 Unit 10094443
- 2202 Montrose (Lot 3) Rd
- 949 Pendergrass Rd
- 495 Horseshoe Rd
- 450 Addor Rd
- 2918 Calloway Rd
- 145 Horizon Trail
- 164 Sofias Ct
- 277 Ashley Dr
- 373 Ashley Dr
- 452 Ashley Heights (Lot 24) Dr
- 158 Woodsrun St
- 515 Ashley Dr
- 193 Cafe Prince Ct
- 218 Woodsrun St
Your Personal Tour Guide
Ask me questions while you tour the home.