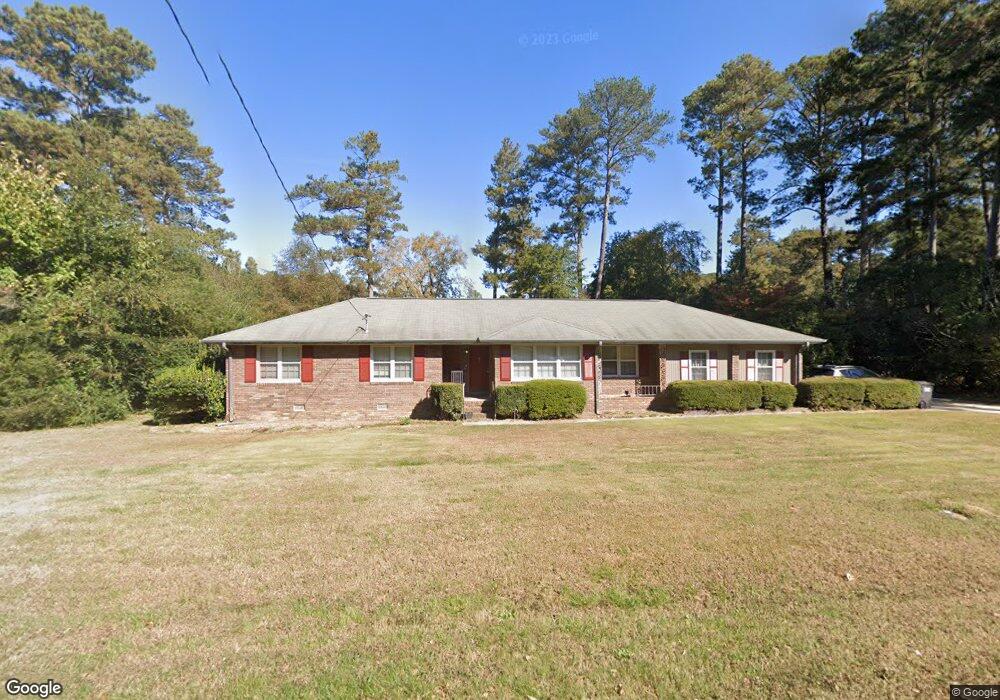
1250 Maple St SE Unit 8 Conyers, GA 30013
Estimated Value: $248,000 - $284,000
4
Beds
2
Baths
2,304
Sq Ft
$117/Sq Ft
Est. Value
About This Home
This home is located at 1250 Maple St SE Unit 8, Conyers, GA 30013 and is currently estimated at $270,427, approximately $117 per square foot. 1250 Maple St SE Unit 8 is a home located in Rockdale County with nearby schools including Flat Shoals Elementary School, Memorial Middle School, and Salem High School.
Ownership History
Date
Name
Owned For
Owner Type
Purchase Details
Closed on
Jan 29, 2021
Sold by
Rodney Etrice J
Bought by
Rodney Etrice J and Napier Same M
Current Estimated Value
Purchase Details
Closed on
Oct 5, 2020
Sold by
Maynard Kenneth M
Bought by
Rodney Etrice J
Home Financials for this Owner
Home Financials are based on the most recent Mortgage that was taken out on this home.
Original Mortgage
$159,948
Interest Rate
2.9%
Mortgage Type
New Conventional
Purchase Details
Closed on
May 4, 2015
Sold by
Lee Heather Davis
Bought by
Maynard Schelly and Maynard Kenneth M
Home Financials for this Owner
Home Financials are based on the most recent Mortgage that was taken out on this home.
Original Mortgage
$84,427
Interest Rate
3.75%
Mortgage Type
FHA
Purchase Details
Closed on
Dec 12, 2013
Sold by
Davis William Albert
Bought by
Lee Heather Davis
Create a Home Valuation Report for This Property
The Home Valuation Report is an in-depth analysis detailing your home's value as well as a comparison with similar homes in the area
Home Values in the Area
Average Home Value in this Area
Purchase History
| Date | Buyer | Sale Price | Title Company |
|---|---|---|---|
| Rodney Etrice J | -- | -- | |
| Rodney Etrice J | $162,900 | -- | |
| Maynard Schelly | $86,000 | -- | |
| Lee Heather Davis | -- | -- |
Source: Public Records
Mortgage History
| Date | Status | Borrower | Loan Amount |
|---|---|---|---|
| Previous Owner | Rodney Etrice J | $159,948 | |
| Previous Owner | Maynard Schelly | $84,427 |
Source: Public Records
Tax History Compared to Growth
Tax History
| Year | Tax Paid | Tax Assessment Tax Assessment Total Assessment is a certain percentage of the fair market value that is determined by local assessors to be the total taxable value of land and additions on the property. | Land | Improvement |
|---|---|---|---|---|
| 2024 | $2,946 | $121,560 | $20,800 | $100,760 |
| 2023 | $2,427 | $105,080 | $20,800 | $84,280 |
| 2022 | $1,977 | $87,560 | $18,440 | $69,120 |
| 2021 | $2,670 | $65,160 | $9,737 | $55,423 |
| 2020 | $1,307 | $58,560 | $8,400 | $50,160 |
| 2019 | $1,004 | $47,640 | $6,600 | $41,040 |
| 2018 | $965 | $46,160 | $6,600 | $39,560 |
| 2017 | $907 | $43,920 | $6,600 | $37,320 |
| 2016 | $548 | $33,920 | $5,120 | $28,800 |
| 2015 | $1,380 | $30,280 | $4,160 | $26,120 |
| 2014 | $9 | $30,280 | $4,160 | $26,120 |
| 2013 | -- | $44,920 | $10,200 | $34,720 |
Source: Public Records
Map
Nearby Homes
- 1328 White Oak St SE
- 1368 White Oak St SE Unit 2
- 1625 Old Salem Rd SE
- 664 Browning Ln SE
- Evergreen Plan at Old Salem Crossing
- Crofton Plan at Old Salem Crossing
- Ivey Plan at Old Salem Crossing
- Holly Plan at Old Salem Crossing
- Linton Plan at Old Salem Crossing
- Hanover Plan at Old Salem Crossing
- Glen Plan at Old Salem Crossing
- Redland Plan at Old Salem Crossing
- 1577 Salem Dr Unit 82
- 1581 Salem Dr Unit 80
- 1585 Salem Dr Unit 78
- 661 Browning Ln SE
- 1575 Aiden Way Unit 38
- 1569 Aiden Way Unit 35
- 1567 Aiden Way Unit 34
- 1390 White Oak St SE
- 1250 Maple St SE
- 1230 Maple St SE
- 1648 Walnut Dr SE
- 1661 Maple Ct SE
- 1266 Maple St SE Unit 7
- 1241 Maple St SE
- 1255 Maple St SE
- 1225 Maple St SE
- 1647 Walnut Dr SE
- 1267 Maple St SE
- 1267 Maple St SE Unit 9
- 1636 Walnut Dr SE
- 1659 Maple Ct SE
- 1723 Sara Ct SE Unit 1
- 1723 Sara Ct SE
- 1645 Walnut Dr SE
- 1726 Sara Ct SE
- 1322 White Oak St SE
- 1290 Maple St SE
- 1210 Maple St SE