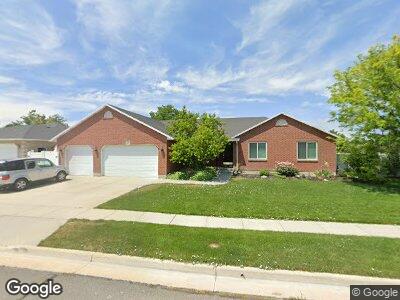
1250 Margaret Rose Dr Riverton, UT 84065
Estimated Value: $661,000 - $706,162
3
Beds
3
Baths
4,444
Sq Ft
$153/Sq Ft
Est. Value
About This Home
This home is located at 1250 Margaret Rose Dr, Riverton, UT 84065 and is currently estimated at $682,041, approximately $153 per square foot. 1250 Margaret Rose Dr is a home located in Salt Lake County with nearby schools including Rosamond Elementary School, Oquirrh Hills Middle School, and Riverton High School.
Ownership History
Date
Name
Owned For
Owner Type
Purchase Details
Closed on
Jan 7, 2003
Sold by
Bates James K and Bates Jeanne V
Bought by
Bates James Keith and Bates Jeanne
Current Estimated Value
Home Financials for this Owner
Home Financials are based on the most recent Mortgage that was taken out on this home.
Original Mortgage
$174,000
Interest Rate
6.06%
Purchase Details
Closed on
Dec 24, 2002
Sold by
Bates James Keith and Bates Jeanne V
Bought by
Bates James K and Bates Jeanne
Home Financials for this Owner
Home Financials are based on the most recent Mortgage that was taken out on this home.
Original Mortgage
$174,000
Interest Rate
6.06%
Purchase Details
Closed on
Dec 9, 1999
Sold by
Ron Thorne Construction Inc
Bought by
Bates James Keith and Bates Jeanne
Home Financials for this Owner
Home Financials are based on the most recent Mortgage that was taken out on this home.
Original Mortgage
$180,160
Interest Rate
7.96%
Create a Home Valuation Report for This Property
The Home Valuation Report is an in-depth analysis detailing your home's value as well as a comparison with similar homes in the area
Home Values in the Area
Average Home Value in this Area
Purchase History
| Date | Buyer | Sale Price | Title Company |
|---|---|---|---|
| Bates James Keith | -- | Landmark Title | |
| Bates James K | -- | Landmark Title | |
| Bates James Keith | -- | Merrill Title |
Source: Public Records
Mortgage History
| Date | Status | Borrower | Loan Amount |
|---|---|---|---|
| Open | Bates James Keith | $135,000 | |
| Closed | Bates James Keith | $138,450 | |
| Closed | Bates James Keith | $174,000 | |
| Closed | Bates James Keith | $180,160 |
Source: Public Records
Tax History Compared to Growth
Tax History
| Year | Tax Paid | Tax Assessment Tax Assessment Total Assessment is a certain percentage of the fair market value that is determined by local assessors to be the total taxable value of land and additions on the property. | Land | Improvement |
|---|---|---|---|---|
| 2023 | $3,765 | $614,300 | $234,600 | $379,700 |
| 2022 | $3,922 | $627,700 | $230,000 | $397,700 |
| 2021 | $3,363 | $479,200 | $195,000 | $284,200 |
| 2020 | $3,205 | $425,900 | $194,000 | $231,900 |
| 2019 | $3,165 | $413,400 | $191,000 | $222,400 |
| 2018 | $2,997 | $385,500 | $138,000 | $247,500 |
| 2017 | $2,879 | $360,800 | $138,000 | $222,800 |
| 2016 | $2,752 | $331,000 | $138,000 | $193,000 |
| 2015 | $2,845 | $331,700 | $158,100 | $173,600 |
| 2014 | $2,690 | $307,500 | $147,900 | $159,600 |
Source: Public Records
Map
Nearby Homes
- 1381 Quail Covey Cir
- 12359 Overlook Ridge Ct
- 1480 W 12330 S
- 1139 Grainery Cove
- 12455 S 1450 W
- 12113 S Lampton View Dr
- 12482 Tithing Point Dr
- 12021 Misty Sea Rd
- 1568 W Big Var Way
- 12076 River Vista Dr
- 1056 W Kate Springs Ln S Unit 10
- 1214 W Matthews Way
- 12325 S Redwood Rd
- 12317 S Redwood Rd
- 1273 W Hendrix St Unit 145
- 1269 W Hendrix St Unit 146
- 1255 W Hendrix St Unit 147
- 12736 S Mccartney Way Unit 104
- 1261 W Moon Way Unit 133
- 1259 W Moon Way Unit 134
- 1250 Margaret Rose Dr
- 1250 W Margaret Rose Dr
- 12298 Margaret Rose Dr
- 1262 Margaret Rose Dr
- 12286 Margaret Rose Dr
- 1249 Margaret Rose Dr
- 1278 Margaret Rose Dr
- 1261 Margaret Rose Dr
- 1277 Margaret Park Dr
- 1237 Margaret Rose Dr
- 1277 W Margaret Park Dr
- 12297 Margaret Rose Dr
- 12297 S Margaret Rose Dr
- 12323 Margaret Rose Dr
- 12337 Margaret Rose Dr
- 1867 W Margaret Park Dr
- 1287 Margaret Park Dr
- 1287 W Margaret Park Dr
- 12283 Margaret Rose Dr
- 12283 S Margaret Rose Dr