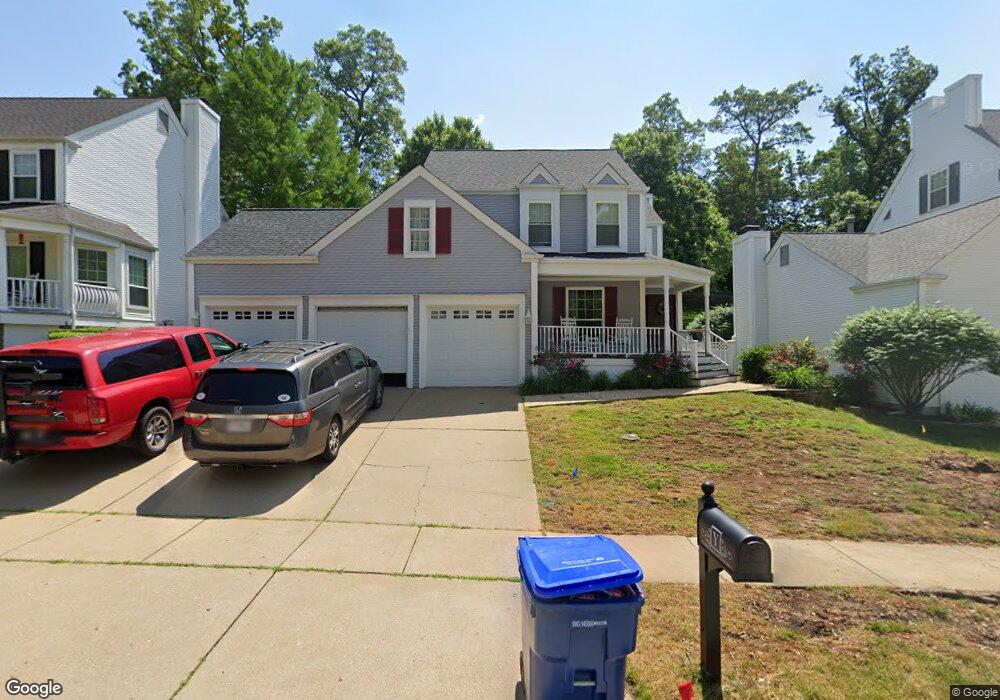
1250 Red Oak Plantation Dr Ballwin, MO 63021
Estimated Value: $456,000 - $485,000
4
Beds
3
Baths
1,952
Sq Ft
$239/Sq Ft
Est. Value
About This Home
This home is located at 1250 Red Oak Plantation Dr, Ballwin, MO 63021 and is currently estimated at $466,330, approximately $238 per square foot. 1250 Red Oak Plantation Dr is a home located in St. Louis County with nearby schools including Oak Brook Elementary School, Parkway Southwest Middle School, and Parkway South High School.
Ownership History
Date
Name
Owned For
Owner Type
Purchase Details
Closed on
Jun 1, 2006
Sold by
Seiber Karen L
Bought by
Yoder Frank L and Yoder Karen A
Current Estimated Value
Home Financials for this Owner
Home Financials are based on the most recent Mortgage that was taken out on this home.
Original Mortgage
$160,000
Outstanding Balance
$94,120
Interest Rate
6.58%
Mortgage Type
Purchase Money Mortgage
Estimated Equity
$372,210
Purchase Details
Closed on
Apr 24, 2003
Sold by
Boll Joseph H and Boll Sandra M
Bought by
Seiber Karen L
Home Financials for this Owner
Home Financials are based on the most recent Mortgage that was taken out on this home.
Original Mortgage
$135,000
Interest Rate
5.16%
Mortgage Type
Purchase Money Mortgage
Purchase Details
Closed on
Feb 18, 1998
Sold by
Kulcsar Michael J and Kulcsar Adrienne H
Bought by
Boll Joseph H and Boll Sandra M
Home Financials for this Owner
Home Financials are based on the most recent Mortgage that was taken out on this home.
Original Mortgage
$135,000
Interest Rate
7.01%
Create a Home Valuation Report for This Property
The Home Valuation Report is an in-depth analysis detailing your home's value as well as a comparison with similar homes in the area
Home Values in the Area
Average Home Value in this Area
Purchase History
| Date | Buyer | Sale Price | Title Company |
|---|---|---|---|
| Yoder Frank L | $258,000 | None Available | |
| Seiber Karen L | $225,000 | -- | |
| Boll Joseph H | -- | -- |
Source: Public Records
Mortgage History
| Date | Status | Borrower | Loan Amount |
|---|---|---|---|
| Open | Yoder Frank L | $160,000 | |
| Previous Owner | Seiber Karen L | $135,000 | |
| Previous Owner | Boll Joseph H | $135,000 | |
| Closed | Seiber Karen L | $45,000 |
Source: Public Records
Tax History Compared to Growth
Tax History
| Year | Tax Paid | Tax Assessment Tax Assessment Total Assessment is a certain percentage of the fair market value that is determined by local assessors to be the total taxable value of land and additions on the property. | Land | Improvement |
|---|---|---|---|---|
| 2025 | $4,743 | $77,770 | $38,820 | $38,950 |
| 2024 | $4,743 | $73,260 | $20,710 | $52,550 |
| 2023 | $4,743 | $73,260 | $20,710 | $52,550 |
| 2022 | $4,341 | $61,790 | $20,710 | $41,080 |
| 2021 | $4,316 | $61,790 | $20,710 | $41,080 |
| 2020 | $4,339 | $58,880 | $20,710 | $38,170 |
| 2019 | $4,290 | $58,880 | $20,710 | $38,170 |
| 2018 | $3,761 | $47,840 | $20,710 | $27,130 |
| 2017 | $3,654 | $47,840 | $20,710 | $27,130 |
| 2016 | $3,662 | $45,620 | $12,940 | $32,680 |
| 2015 | $3,833 | $45,620 | $12,940 | $32,680 |
| 2014 | $3,507 | $44,580 | $11,860 | $32,720 |
Source: Public Records
Map
Nearby Homes
- 1233 Red Oak Plantation Dr
- 1231 Bedford Falls Ct
- 505 Treetop Village Dr
- 1316 Red Oak Plantation Dr
- 334 Lauren Landing
- 521 Spring Glen Dr
- 531 Spring Glen Dr Unit 71R
- 530 Spring Glen Dr
- 637 Brook Meadow Dr
- 237 Valleyoak Ct
- 586 Brook Meadow Dr
- 640 Painted Vista Dr
- 1222 Meramec Heights Dr Unit 40
- 1152 Hollyberry Dr
- 700 Ridgeside Dr Unit L
- 1201 Lofty Point Dr Unit C
- 708 Ridgeside Dr Unit B
- 313 Oakfield Dr
- 178 Cascade Circle Dr
- 647 Cascade Lake Dr
- 1246 Red Oak Plantation Dr
- 1254 Red Oak Plantation Dr
- 1242 Red Oak Plantation Dr
- 1258 Red Oak Plantation Dr
- 1322 Arbor Bluff Cir
- 1326 Arbor Bluff Cir
- 1318 Arbor Bluff Cir
- 1330 Arbor Bluff Cir
- 1249 Red Oak Plantation Dr
- 1238 Red Oak Plantation Dr
- 1253 Red Oak Plantation Dr
- 1245 Red Oak Plantation Dr
- 1262 Red Oak Plantation Dr
- 1334 Arbor Bluff Cir
- 1241 Red Oak Plantation Dr
- 1257 Red Oak Plantation Dr
- 1314 Arbor Bluff Cir
- 1234 Red Oak Plantation Dr
- 1266 Red Oak Plantation Dr
- 1261 Red Oak Plantation Dr