Estimated Value: $336,000 - $368,000
3
Beds
3
Baths
1,520
Sq Ft
$231/Sq Ft
Est. Value
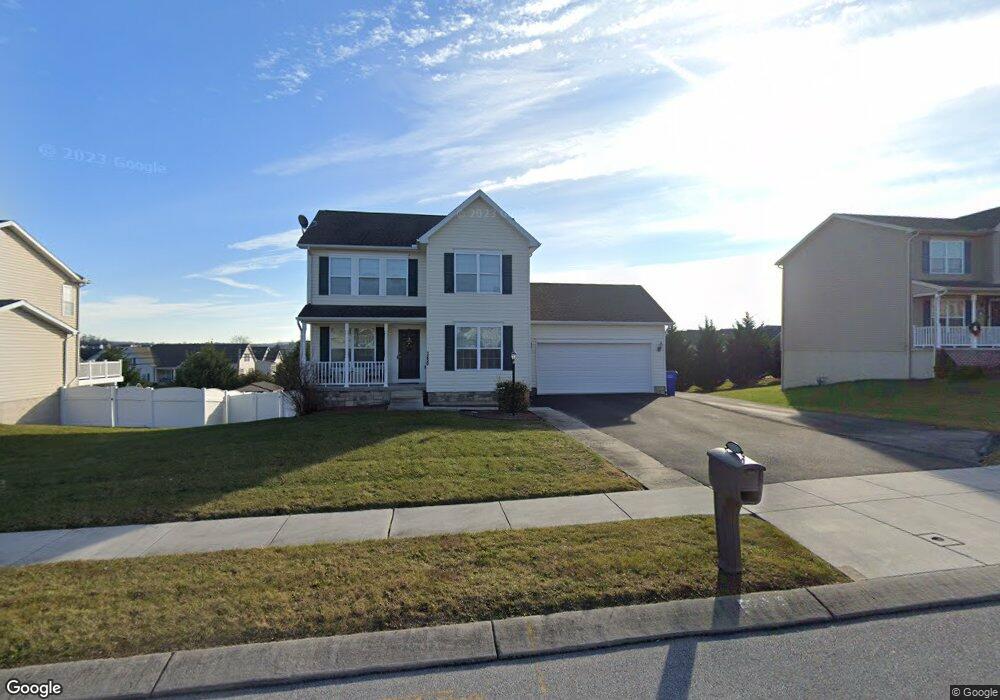
About This Home
This home is located at 1250 Summit Run Ct Unit 4, York, PA 17408 and is currently estimated at $351,634, approximately $231 per square foot. 1250 Summit Run Ct Unit 4 is a home located in York County with nearby schools including Spring Grove Area Middle School, Spring Grove Area High School, and St Rose Of Lima School.
Ownership History
Date
Name
Owned For
Owner Type
Purchase Details
Closed on
Oct 2, 2019
Sold by
Belmont Equity Llc
Bought by
Upton Grant and Upton Destiny S
Current Estimated Value
Home Financials for this Owner
Home Financials are based on the most recent Mortgage that was taken out on this home.
Original Mortgage
$212,555
Outstanding Balance
$186,209
Interest Rate
3.5%
Mortgage Type
New Conventional
Estimated Equity
$165,425
Purchase Details
Closed on
Jan 11, 2018
Sold by
Bale Dawn and The Estate Of Susan Hoke
Bought by
Belmont Equity Llc
Purchase Details
Closed on
Dec 30, 2013
Sold by
Jackson Heights Lp
Bought by
Hoke Scott M and Hoke Susan K
Home Financials for this Owner
Home Financials are based on the most recent Mortgage that was taken out on this home.
Original Mortgage
$171,000
Interest Rate
4.24%
Mortgage Type
New Conventional
Create a Home Valuation Report for This Property
The Home Valuation Report is an in-depth analysis detailing your home's value as well as a comparison with similar homes in the area
Home Values in the Area
Average Home Value in this Area
Purchase History
| Date | Buyer | Sale Price | Title Company |
|---|---|---|---|
| Upton Grant | $208,900 | Title Services | |
| Belmont Equity Llc | $159,000 | None Available | |
| Hoke Scott M | $180,000 | None Available |
Source: Public Records
Mortgage History
| Date | Status | Borrower | Loan Amount |
|---|---|---|---|
| Open | Upton Grant | $212,555 | |
| Previous Owner | Hoke Scott M | $171,000 |
Source: Public Records
Tax History Compared to Growth
Tax History
| Year | Tax Paid | Tax Assessment Tax Assessment Total Assessment is a certain percentage of the fair market value that is determined by local assessors to be the total taxable value of land and additions on the property. | Land | Improvement |
|---|---|---|---|---|
| 2025 | $6,548 | $197,500 | $73,680 | $123,820 |
| 2024 | $6,476 | $197,500 | $73,680 | $123,820 |
| 2023 | $6,476 | $197,500 | $73,680 | $123,820 |
| 2022 | $6,476 | $197,500 | $73,680 | $123,820 |
| 2021 | $6,195 | $197,500 | $73,680 | $123,820 |
| 2020 | $6,195 | $197,500 | $73,680 | $123,820 |
| 2019 | $6,061 | $197,500 | $73,680 | $123,820 |
| 2018 | $5,980 | $197,500 | $73,680 | $123,820 |
| 2017 | $5,841 | $197,500 | $73,680 | $123,820 |
| 2016 | $0 | $197,500 | $73,680 | $123,820 |
| 2015 | -- | $196,960 | $73,680 | $123,280 |
| 2014 | -- | $196,960 | $73,680 | $123,280 |
Source: Public Records
Map
Nearby Homes
- 1238 Knoll Dr
- 160 Dolomite Dr Unit 12B
- 137 Mineral Dr Unit 30
- 1245 Pinnacle Ct
- 5 Landing Place Unit 5 - MODEL
- 20 Landing Place Unit 20
- 22 Landing Place Unit 22
- 21 Landing Place Unit 21
- 7 Landing Place Unit 7
- 19 Landing Place Unit 19
- 4 Landing Place Unit 4
- 8 Cedarlyn Dr
- 1165 Ledge Dr
- 1143 Willow Ct Unit 165
- 304 Mesa Ln
- 335 Cape Climb
- 1020 Hanover Rd
- 1127 Alder Ct
- 282 Valley View Cir Unit 141
- 102 Pine Springs Blvd
- 1250 Summit Run Ct
- 1242 Summit Run Ct Unit 3
- 1258 Summit Run Ct
- 1258 Summit Run Ct Unit 5
- 1234 Summit Run Ct Unit 2
- 1234 Summit Run Ct
- 1504 Hanover Rd
- 1247 Summit Run Ct
- 1255 Summit Run Ct
- 1239 Summit Run Ct
- 1263 Summit Run Ct
- 1274 Summit Run Ct Unit 7
- 1274 Summit Run Ct
- 10 N Alpine Dr Unit 1
- 1228 Summit Run Ct Unit 1
- 1228 Summit Run Ct
- lot 1 or 2 Summit Run Ct
- lot 1 or 2 Summit Run Ct Unit 1
- 1231 Summit Run Ct
- 1271 Summit Run Ct Unit 62