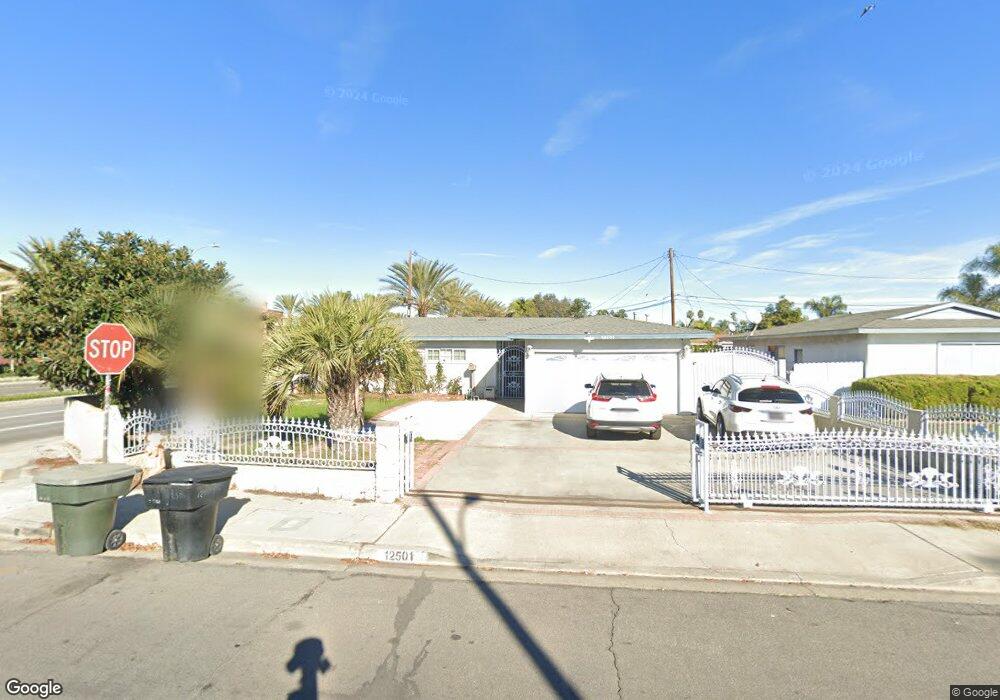
12501 Blue Spruce Ave Garden Grove, CA 92840
Estimated Value: $850,000 - $1,066,000
5
Beds
3
Baths
1,736
Sq Ft
$541/Sq Ft
Est. Value
About This Home
This home is located at 12501 Blue Spruce Ave, Garden Grove, CA 92840 and is currently estimated at $938,580, approximately $540 per square foot. 12501 Blue Spruce Ave is a home located in Orange County with nearby schools including Earl Warren Elementary School, Izaak Walton Intermediate School, and Santiago High School.
Ownership History
Date
Name
Owned For
Owner Type
Purchase Details
Closed on
Aug 6, 2025
Sold by
Tong Phuong Kim and Tong Jenny Kim
Bought by
Tong Jenny Kim
Current Estimated Value
Purchase Details
Closed on
Nov 18, 2003
Sold by
Vanvannguyen Hop Van
Bought by
Tong Phuong Kim
Home Financials for this Owner
Home Financials are based on the most recent Mortgage that was taken out on this home.
Original Mortgage
$263,200
Interest Rate
5.89%
Mortgage Type
Purchase Money Mortgage
Purchase Details
Closed on
Oct 17, 2003
Sold by
Warren Mervin W
Bought by
Tong Phuong Kim
Home Financials for this Owner
Home Financials are based on the most recent Mortgage that was taken out on this home.
Original Mortgage
$263,200
Interest Rate
5.89%
Mortgage Type
Purchase Money Mortgage
Create a Home Valuation Report for This Property
The Home Valuation Report is an in-depth analysis detailing your home's value as well as a comparison with similar homes in the area
Home Values in the Area
Average Home Value in this Area
Purchase History
| Date | Buyer | Sale Price | Title Company |
|---|---|---|---|
| Tong Jenny Kim | -- | None Listed On Document | |
| Tong Phuong Kim | -- | Lawyers Title | |
| Tong Phuong Kim | $329,000 | Lawyers Title |
Source: Public Records
Mortgage History
| Date | Status | Borrower | Loan Amount |
|---|---|---|---|
| Previous Owner | Tong Phuong Kim | $263,200 |
Source: Public Records
Tax History Compared to Growth
Tax History
| Year | Tax Paid | Tax Assessment Tax Assessment Total Assessment is a certain percentage of the fair market value that is determined by local assessors to be the total taxable value of land and additions on the property. | Land | Improvement |
|---|---|---|---|---|
| 2025 | $6,953 | $564,296 | $406,658 | $157,638 |
| 2024 | $6,953 | $553,232 | $398,684 | $154,548 |
| 2023 | $6,825 | $542,385 | $390,867 | $151,518 |
| 2022 | $6,674 | $531,750 | $383,202 | $148,548 |
| 2021 | $6,579 | $521,324 | $375,688 | $145,636 |
| 2020 | $6,500 | $515,979 | $371,836 | $144,143 |
| 2019 | $6,410 | $505,862 | $364,545 | $141,317 |
| 2018 | $6,251 | $495,944 | $357,397 | $138,547 |
| 2017 | $6,186 | $486,220 | $350,389 | $135,831 |
| 2016 | $5,873 | $476,687 | $343,519 | $133,168 |
| 2015 | $5,696 | $461,000 | $340,980 | $120,020 |
| 2014 | $5,223 | $422,784 | $302,764 | $120,020 |
Source: Public Records
Map
Nearby Homes
- 12691 Sweetbriar Dr
- 12621 Sweetbriar Dr
- 12842 Palm St Unit 108
- 12850 Palm St Unit 6
- 12905 Palm St
- 12812 Timber Rd Unit 22
- 12722 Aspenwood Ln
- 12848 Timber Rd Unit 33
- 12222 Emrys Ave
- 13096 Blackbird St Unit 82
- 13096 Blackbird St Unit 11
- 13096 Blackbird St Unit 164
- 13096 Blackbird St Unit 67
- 12342 Quartz Place
- 12071 Acacia Ave
- 13102 Partridge St Unit 7
- 13102 Partridge St Unit 54
- 12414 Fallingleaf St
- 12727 West St
- 12246 Nadine Cir
- 12521 Blue Spruce Ave
- 12502 Sandalwood Ln
- 12522 Sandalwood Ln
- 12531 Blue Spruce Ave
- 12532 Sandalwood Ln
- 12502 Blue Spruce Ave
- 12522 Blue Spruce Ave
- 12541 Blue Spruce Ave
- 12532 Blue Spruce Ave
- 12542 Sandalwood Ln
- 12542 Blue Spruce Ave
- 12501 Sandalwood Ln
- 12521 Sandalwood Ln
- 12501 Aspenwood Ln
- 12531 Sandalwood Ln
- 12741 Choisser Rd
- 12521 Aspenwood Ln
- 12541 Sandalwood Ln
- 12531 Aspenwood Ln
- 12702 Choisser Rd