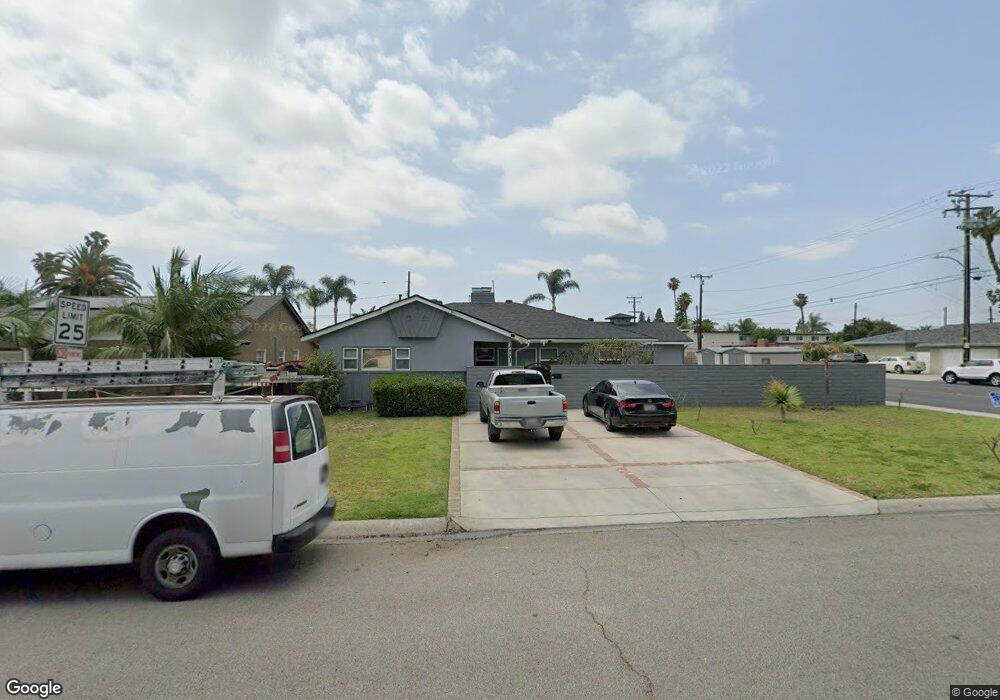
12501 Groveview St Garden Grove, CA 92840
Estimated Value: $887,000 - $1,154,000
3
Beds
2
Baths
1,771
Sq Ft
$601/Sq Ft
Est. Value
About This Home
This home is located at 12501 Groveview St, Garden Grove, CA 92840 and is currently estimated at $1,064,058, approximately $600 per square foot. 12501 Groveview St is a home located in Orange County with nearby schools including Brookhurst Elementary School, Garden Grove High School, and St. Columban School.
Ownership History
Date
Name
Owned For
Owner Type
Purchase Details
Closed on
Aug 30, 2002
Sold by
Ham James
Bought by
Ham Youn Ja
Current Estimated Value
Home Financials for this Owner
Home Financials are based on the most recent Mortgage that was taken out on this home.
Original Mortgage
$266,400
Outstanding Balance
$111,690
Interest Rate
6.29%
Estimated Equity
$952,368
Purchase Details
Closed on
Apr 16, 2001
Sold by
Mcmains Elizabeth
Bought by
Ham James and Ham Youn Ja
Home Financials for this Owner
Home Financials are based on the most recent Mortgage that was taken out on this home.
Original Mortgage
$272,000
Interest Rate
6.89%
Mortgage Type
Stand Alone First
Purchase Details
Closed on
Sep 12, 1995
Sold by
Lay Albert C and Mcmains Elizabeth
Bought by
Mcmains Elizabeth
Purchase Details
Closed on
Aug 24, 1995
Sold by
Agnew Daryl L
Bought by
Lay Albert C and Mcmains Elizabeth
Create a Home Valuation Report for This Property
The Home Valuation Report is an in-depth analysis detailing your home's value as well as a comparison with similar homes in the area
Home Values in the Area
Average Home Value in this Area
Purchase History
| Date | Buyer | Sale Price | Title Company |
|---|---|---|---|
| Ham Youn Ja | -- | American Title Co | |
| Ham James | $272,000 | Orange Coast Title | |
| Mcmains Elizabeth | -- | -- | |
| Lay Albert C | -- | -- |
Source: Public Records
Mortgage History
| Date | Status | Borrower | Loan Amount |
|---|---|---|---|
| Open | Ham Youn Ja | $266,400 | |
| Closed | Ham James | $272,000 | |
| Closed | Ham James | $40,800 |
Source: Public Records
Tax History Compared to Growth
Tax History
| Year | Tax Paid | Tax Assessment Tax Assessment Total Assessment is a certain percentage of the fair market value that is determined by local assessors to be the total taxable value of land and additions on the property. | Land | Improvement |
|---|---|---|---|---|
| 2025 | $5,080 | $409,851 | $286,420 | $123,431 |
| 2024 | $5,080 | $401,815 | $280,804 | $121,011 |
| 2023 | $4,984 | $393,937 | $275,298 | $118,639 |
| 2022 | $4,876 | $386,213 | $269,900 | $116,313 |
| 2021 | $4,823 | $378,641 | $264,608 | $114,033 |
| 2020 | $4,759 | $374,759 | $261,895 | $112,864 |
| 2019 | $4,667 | $367,411 | $256,760 | $110,651 |
| 2018 | $4,574 | $360,207 | $251,725 | $108,482 |
| 2017 | $4,510 | $353,145 | $246,790 | $106,355 |
| 2016 | $4,288 | $346,221 | $241,951 | $104,270 |
| 2015 | $4,227 | $341,021 | $238,317 | $102,704 |
| 2014 | $4,124 | $334,341 | $233,648 | $100,693 |
Source: Public Records
Map
Nearby Homes
- 10181 Lampson Ave
- 12266 Madras Place
- 12262 Morrie Ln
- 10442 Lampson Ave
- 10520 Lakeside Dr N Unit L
- 12342 Rea Cir
- 10541 Lakeside Dr S Unit P
- 10371 Garden Grove Blvd Unit 16
- 10371 Garden Grove Blvd Unit 20
- 10580 Lakeside Dr N Unit E
- 10560 Lakeside Dr N Unit B
- 10521 Lakeside Dr S Unit I
- 10361 Garden Grove Blvd Unit 30
- 10401 Garden Grove Blvd Unit 44
- 10401 W Garden Grove Blvd Unit 53
- 11912 Brookhaven St Unit 65
- 9931 Central Ave
- 9651 Crosby Ave
- 10002 Central Ave Unit 27
- 10002 Central Ave
- 12511 Groveview St
- 10102 Lampson Ave
- 12521 Groveview St
- 10131 Lampson Ave
- 10141 Lampson Ave
- 12512 Fletcher Dr
- 12532 Fletcher Dr
- 12502 Groveview St
- 12512 Groveview St
- 12542 Fletcher Dr
- 12531 Groveview St
- 10171 Lampson Ave
- 12522 Groveview St
- 12441 Groveview St
- 10119 1/2 Lampson Ave
- 10121 Lampson Ave
- 12552 Fletcher Dr
- 12561 Groveview St
- 12532 Groveview St
- 10101 Lampson Ave