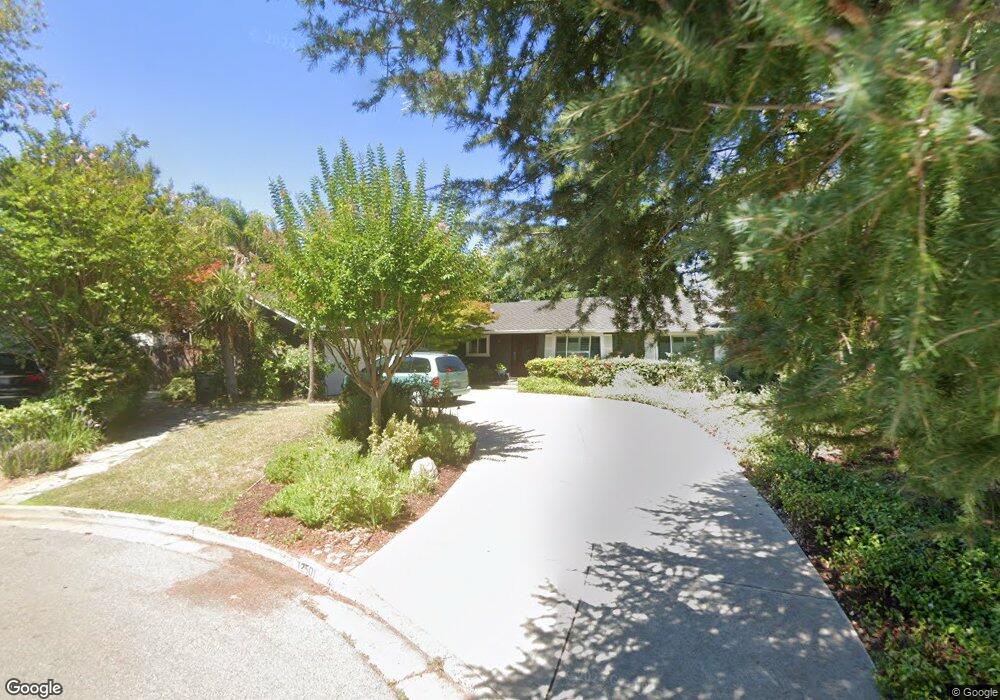
12501 Jolene Ct Saratoga, CA 95070
West San Jose NeighborhoodEstimated Value: $3,115,000 - $3,619,442
3
Beds
3
Baths
1,726
Sq Ft
$1,952/Sq Ft
Est. Value
About This Home
This home is located at 12501 Jolene Ct, Saratoga, CA 95070 and is currently estimated at $3,368,611, approximately $1,951 per square foot. 12501 Jolene Ct is a home located in Santa Clara County with nearby schools including Country Lane Elementary School, Moreland Middle School, and Prospect High School.
Ownership History
Date
Name
Owned For
Owner Type
Purchase Details
Closed on
Oct 28, 2014
Sold by
Huang Thomas Hongxing and Zheng Huang Cindy Jinghui
Bought by
Thomas & Cindy Huang Trust and Zheng Huang Cindy Jinghui
Current Estimated Value
Purchase Details
Closed on
Nov 22, 2011
Sold by
Huang Thomas H and Zheng Huang Cindy J
Bought by
Huang Thomas H and Zheng Huang Cindy J
Home Financials for this Owner
Home Financials are based on the most recent Mortgage that was taken out on this home.
Original Mortgage
$880,000
Outstanding Balance
$588,365
Interest Rate
3.62%
Mortgage Type
New Conventional
Estimated Equity
$2,780,246
Purchase Details
Closed on
Jun 2, 2011
Sold by
Gagliasso Robert M and Gagliasso William F
Bought by
Huang Thomas H and Zheng Huang Cindy J
Home Financials for this Owner
Home Financials are based on the most recent Mortgage that was taken out on this home.
Original Mortgage
$882,500
Interest Rate
4.12%
Mortgage Type
New Conventional
Create a Home Valuation Report for This Property
The Home Valuation Report is an in-depth analysis detailing your home's value as well as a comparison with similar homes in the area
Home Values in the Area
Average Home Value in this Area
Purchase History
| Date | Buyer | Sale Price | Title Company |
|---|---|---|---|
| Thomas & Cindy Huang Trust | -- | None Available | |
| Huang Thomas H | -- | Chicago Title Company | |
| Huang Thomas H | $1,198,000 | Chicago Title Company |
Source: Public Records
Mortgage History
| Date | Status | Borrower | Loan Amount |
|---|---|---|---|
| Open | Huang Thomas H | $880,000 | |
| Closed | Huang Thomas H | $882,500 |
Source: Public Records
Tax History Compared to Growth
Tax History
| Year | Tax Paid | Tax Assessment Tax Assessment Total Assessment is a certain percentage of the fair market value that is determined by local assessors to be the total taxable value of land and additions on the property. | Land | Improvement |
|---|---|---|---|---|
| 2025 | $20,778 | $1,644,114 | $1,088,995 | $555,119 |
| 2024 | $20,778 | $1,611,878 | $1,067,643 | $544,235 |
| 2023 | $20,597 | $1,580,273 | $1,046,709 | $533,564 |
| 2022 | $20,218 | $1,549,288 | $1,026,186 | $523,102 |
| 2021 | $19,931 | $1,518,911 | $1,006,065 | $512,846 |
| 2020 | $19,642 | $1,503,338 | $995,750 | $507,588 |
| 2019 | $18,866 | $1,473,862 | $976,226 | $497,636 |
| 2018 | $18,498 | $1,444,964 | $957,085 | $487,879 |
| 2017 | $18,252 | $1,416,632 | $938,319 | $478,313 |
| 2016 | $17,264 | $1,388,856 | $919,921 | $468,935 |
| 2015 | $17,107 | $1,367,995 | $906,103 | $461,892 |
| 2014 | $16,704 | $1,341,199 | $888,354 | $452,845 |
Source: Public Records
Map
Nearby Homes
- 12584 Paseo Flores
- 11315 Cottonwood Place Unit 39-09 Plan 3
- 11210 Cottonwood Place Unit 35-08 Plan 4
- 11220 Cottonwood Place Unit 36-08 Plan 2
- 11240 Cottonwood Place Unit 38-08 Plan 3
- Plan 2 at The Elms
- Plan 3 at The Elms
- Plan 4 at The Elms
- 11645 Redwood Place Unit 56-12 Plan 4
- 11115 Maple Place Unit 30-07
- 11125 Maple Place Unit 31-07 Plan 2
- 11145 Maple Place Unit 33-07 Plan 2
- 11155 Maple Place Unit 34-07 Plan 3
- 10750 Elm Cir Unit 88-17 Plan 2
- 11040 Maple Place Unit 28-06 Plan 2
- 11050 Maple Place Unit 29-06 Plan 3
- 11010 Maple Place Unit 25-06 Plan 4
- 10730 Elm Cir Unit 86-17 Plan 2
- 10330 Elm Cir Unit 12-03 Plan 2
- 1957 Colusa Way
- 12511 Jolene Ct
- 12491 Jolene Ct
- 12480 Radoyka Dr
- 12470 Radoyka Dr
- 12490 Radoyka Dr
- 12510 Jolene Ct
- 18740 Westview Dr
- 12500 Jolene Ct
- 12481 Jolene Ct
- 18767 Wood Dell Ct
- 18745 Wood Dell Ct
- 12490 Jolene Ct
- 18789 Wood Dell Ct
- 12508 Radoyka Dr
- 18723 Wood Dell Ct
- 12471 Radoyka Dr
- 12481 Radoyka Dr
- 18770 Westview Dr
- 12537 Saratoga Ave
- 18690 Westview Dr