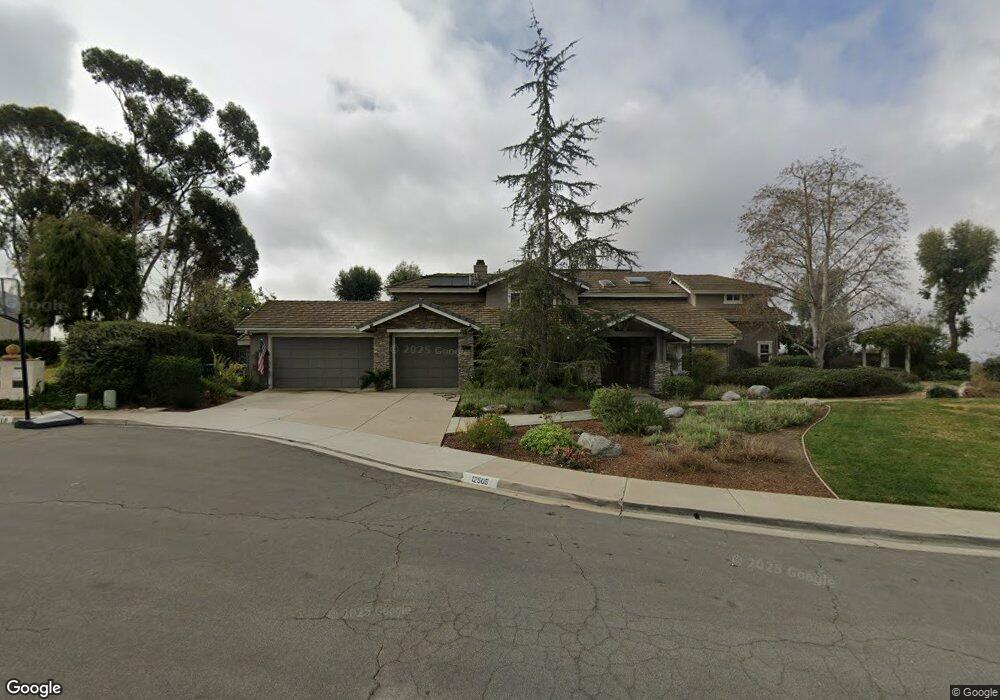
12505 Birch Bluff Ct San Diego, CA 92131
Scripps Ranch NeighborhoodEstimated Value: $2,267,895 - $2,927,000
4
Beds
3
Baths
3,638
Sq Ft
$693/Sq Ft
Est. Value
About This Home
This home is located at 12505 Birch Bluff Ct, San Diego, CA 92131 and is currently estimated at $2,521,224, approximately $693 per square foot. 12505 Birch Bluff Ct is a home located in San Diego County with nearby schools including Jerabek Elementary School, Thurgood Marshall Middle School, and Scripps Ranch High School.
Ownership History
Date
Name
Owned For
Owner Type
Purchase Details
Closed on
May 15, 2014
Sold by
Gabele John L and Gabele Cheryl
Bought by
Gabele Family Trust
Current Estimated Value
Purchase Details
Closed on
Jul 20, 2009
Sold by
Gabele John L and Gabele Cheryl
Bought by
Gabele John L and Gabele Cheryl
Home Financials for this Owner
Home Financials are based on the most recent Mortgage that was taken out on this home.
Original Mortgage
$417,000
Interest Rate
5.59%
Mortgage Type
Stand Alone Refi Refinance Of Original Loan
Purchase Details
Closed on
Jul 2, 2001
Sold by
Maller Leo and Maller Bernice
Bought by
Gabelle John L and Gabelle Cheryl
Purchase Details
Closed on
Jun 4, 1997
Sold by
Kwai Mervin L and Kwai Janice L
Bought by
Gabele John L and Gabele Cheryl
Home Financials for this Owner
Home Financials are based on the most recent Mortgage that was taken out on this home.
Original Mortgage
$338,850
Interest Rate
10.12%
Create a Home Valuation Report for This Property
The Home Valuation Report is an in-depth analysis detailing your home's value as well as a comparison with similar homes in the area
Home Values in the Area
Average Home Value in this Area
Purchase History
| Date | Buyer | Sale Price | Title Company |
|---|---|---|---|
| Gabele Family Trust | -- | None Available | |
| Gabele John L | -- | Ticor Title Company | |
| Gabelle John L | $4,000 | Commonwealth Land Title Co | |
| Maller Leo | $4,000 | Commonwealth Land Title Co | |
| Gabele John L | $376,500 | Commonwealth Land Title Co |
Source: Public Records
Mortgage History
| Date | Status | Borrower | Loan Amount |
|---|---|---|---|
| Closed | Gabele John L | $417,000 | |
| Previous Owner | Gabele John L | $338,850 |
Source: Public Records
Tax History Compared to Growth
Tax History
| Year | Tax Paid | Tax Assessment Tax Assessment Total Assessment is a certain percentage of the fair market value that is determined by local assessors to be the total taxable value of land and additions on the property. | Land | Improvement |
|---|---|---|---|---|
| 2025 | $10,153 | $834,149 | $219,975 | $614,174 |
| 2024 | $10,153 | $817,794 | $215,662 | $602,132 |
| 2023 | $9,924 | $801,760 | $211,434 | $590,326 |
| 2022 | $9,652 | $786,040 | $207,289 | $578,751 |
| 2021 | $9,577 | $770,628 | $203,225 | $567,403 |
| 2020 | $9,459 | $762,727 | $201,142 | $561,585 |
| 2019 | $9,289 | $747,773 | $197,199 | $550,574 |
| 2018 | $8,687 | $733,112 | $193,333 | $539,779 |
| 2017 | $8,478 | $718,739 | $189,543 | $529,196 |
| 2016 | $8,342 | $704,647 | $185,827 | $518,820 |
| 2015 | $8,216 | $694,063 | $183,036 | $511,027 |
| 2014 | $8,086 | $680,468 | $179,451 | $501,017 |
Source: Public Records
Map
Nearby Homes
- 10575 Spruce Grove Ave
- 10976 Caminito Alto
- 11393 Vista Elevada
- 12516 Rougemont Place
- 12432 Caminito Brioso
- 10304 Spruce Grove Ave
- 12026 Medoc Ln
- 12061 Rue Des Amis
- 11313 Wild Meadow Place
- 11495 Cypress Canyon Rd
- 11837 La Colina Rd
- 11787 La Colina Rd
- 11954 Cypress Valley Dr
- 13303 Greenstone Ct
- 11721 Treadwell Dr
- 10405 White Birch Dr
- 13388 Greenstone Ct
- 10616 Falcon Rim Point
- 11766 Treadwell Dr
- 10415 Mesa Madera Dr
- 10667 Birch Bluff Ave
- 12515 Birch Bluff Ct
- 10657 Birch Bluff Ave
- 10676 Birch Bluff Ave
- 12506 Birch Bluff Ct
- 10706 Birch Bluff Ave
- 12516 Birch Bluff Ct
- 10668 Birch Bluff Ave
- 10656 Birch Bluff Ave
- 10716 Birch Bluff Ave
- 10727 Birch Bluff Ave
- 10637 Birch Bluff Ave
- 10646 Birch Bluff Ave
- 10726 Birch Bluff Ave
- 10736 Birch Bluff Ave
- 10633 Birch Bluff Ave
- 10737 Birch Bluff Ave
- 10627 Birch Bluff Ave
- 10746 Birch Bluff Ave
- 10747 Edenoaks St