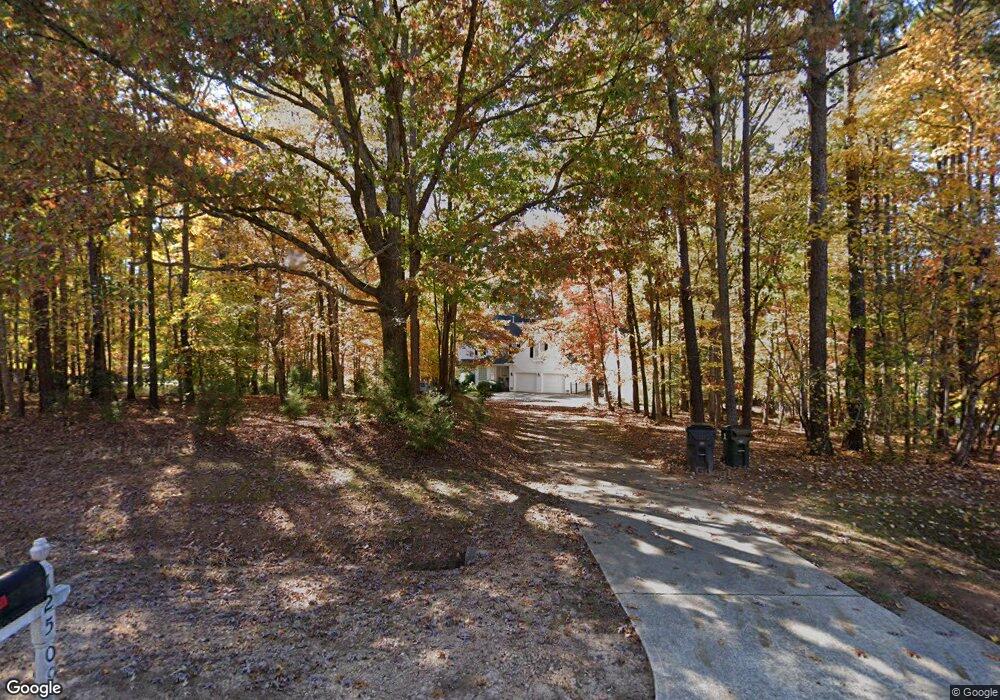
12509 Raven Ridge Rd Raleigh, NC 27614
Falls Lake NeighborhoodEstimated Value: $1,007,820 - $1,226,000
4
Beds
4
Baths
4,216
Sq Ft
$268/Sq Ft
Est. Value
About This Home
This home is located at 12509 Raven Ridge Rd, Raleigh, NC 27614 and is currently estimated at $1,128,955, approximately $267 per square foot. 12509 Raven Ridge Rd is a home located in Wake County with nearby schools including Brassfield Elementary School, West Millbrook Middle School, and Millbrook High School.
Ownership History
Date
Name
Owned For
Owner Type
Purchase Details
Closed on
Aug 21, 2012
Sold by
Mcswiney Linda S and Mcswiney Benjamin L
Bought by
Purvis Randall A and Purvis Tina R
Current Estimated Value
Home Financials for this Owner
Home Financials are based on the most recent Mortgage that was taken out on this home.
Original Mortgage
$105,000
Outstanding Balance
$72,327
Interest Rate
3.55%
Mortgage Type
Credit Line Revolving
Estimated Equity
$1,056,628
Purchase Details
Closed on
Nov 8, 2010
Sold by
Mcswiney Benjamin L and Mcswiney Linda S
Bought by
Mcswiney Linda S
Purchase Details
Closed on
Aug 23, 2005
Sold by
Rodman Jack E and Scheele Carol Ann
Bought by
Mcswiney Benjamin L and Mcswiney Linda S
Home Financials for this Owner
Home Financials are based on the most recent Mortgage that was taken out on this home.
Original Mortgage
$585,000
Interest Rate
8.25%
Mortgage Type
Fannie Mae Freddie Mac
Purchase Details
Closed on
Oct 27, 1997
Sold by
Wayne M Gibson Building Corp
Bought by
Rodman Jack E and Scheele Carol Ann
Create a Home Valuation Report for This Property
The Home Valuation Report is an in-depth analysis detailing your home's value as well as a comparison with similar homes in the area
Home Values in the Area
Average Home Value in this Area
Purchase History
| Date | Buyer | Sale Price | Title Company |
|---|---|---|---|
| Purvis Randall A | $580,000 | None Available | |
| Mcswiney Linda S | -- | None Available | |
| Mcswiney Benjamin L | $585,000 | None Available | |
| Rodman Jack E | $448,500 | -- |
Source: Public Records
Mortgage History
| Date | Status | Borrower | Loan Amount |
|---|---|---|---|
| Open | Purvis Randall A | $105,000 | |
| Previous Owner | Mcswiney Benjamin L | $585,000 |
Source: Public Records
Tax History Compared to Growth
Tax History
| Year | Tax Paid | Tax Assessment Tax Assessment Total Assessment is a certain percentage of the fair market value that is determined by local assessors to be the total taxable value of land and additions on the property. | Land | Improvement |
|---|---|---|---|---|
| 2025 | $5,136 | $799,829 | $220,000 | $579,829 |
| 2024 | $4,987 | $799,829 | $220,000 | $579,829 |
| 2023 | $5,511 | $704,185 | $140,000 | $564,185 |
| 2022 | $5,106 | $704,185 | $140,000 | $564,185 |
| 2021 | $4,968 | $704,185 | $140,000 | $564,185 |
| 2020 | $4,886 | $704,185 | $140,000 | $564,185 |
| 2019 | $4,941 | $602,584 | $140,000 | $462,584 |
| 2018 | $4,542 | $602,584 | $140,000 | $462,584 |
| 2017 | $4,304 | $602,584 | $140,000 | $462,584 |
| 2016 | $4,217 | $602,584 | $140,000 | $462,584 |
| 2015 | $4,434 | $635,628 | $175,000 | $460,628 |
| 2014 | $4,202 | $635,628 | $175,000 | $460,628 |
Source: Public Records
Map
Nearby Homes
- 12301 Hardee Rd
- 1508 Acres Way
- 6820 Brixley Cir
- 1421 Alpine Creek Dr
- 5420 Deer Forest Trail
- 308 Swans Mill Crossing
- 12712 Lindley Dr
- 1209 Ravens Point Cir
- 6729 Greywalls Ln
- 12812 Lindley Dr
- 15517 Possum Track Rd
- 600 Brittany Bay E
- 12317 Lockhart Ln
- 11100 Honeycutt Rd
- 1317 Woodgate Manor Ct
- 12037 Deer Run
- 904 Stonecutter Ct
- 900 Stonecutter Ct
- 1301 Glenden Falls Way
- 11920 Aspenwald Dr
- 12521 Raven Ridge Rd
- 1516 Briarwood Place
- 1509 Briarwood Place
- 1601 Briarwood Place
- 12405 Raven Ridge Rd
- 1600 Pine Needle Ct
- 1600 Briarwood Place
- 12604 Pine Needle Ct
- 1605 Briarwood Place
- 1508 Briarwood Place
- 12605 Raven Ridge Rd
- 1504 Brightwater Ct
- 1601 Brook Run Dr
- 1604 Pine Needle Ct
- 1505 Briarwood Place
- 1601 Pine Needle Ct
- 1604 Briarwood Place
- 12329 Chastain Dr
- 12325 Chastain Dr
- 1613 Briarwood Place