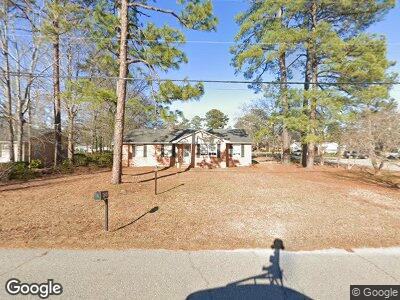
1251 Canterbury Rd Florence, SC 29505
Estimated Value: $228,000 - $258,000
4
Beds
2
Baths
1,755
Sq Ft
$137/Sq Ft
Est. Value
About This Home
This home is located at 1251 Canterbury Rd, Florence, SC 29505 and is currently estimated at $241,189, approximately $137 per square foot. 1251 Canterbury Rd is a home located in Florence County with nearby schools including McLaurin Elementary School, Southside Middle School, and South Florence High School.
Ownership History
Date
Name
Owned For
Owner Type
Purchase Details
Closed on
May 23, 2007
Sold by
Womack Matthew A
Bought by
Stanton Jack L and Stanton Tracy Hill
Current Estimated Value
Home Financials for this Owner
Home Financials are based on the most recent Mortgage that was taken out on this home.
Original Mortgage
$158,175
Interest Rate
6.17%
Mortgage Type
Purchase Money Mortgage
Purchase Details
Closed on
Jan 20, 2005
Sold by
Gaskin Elizabeth
Bought by
Real Estate Enterprises Llc
Home Financials for this Owner
Home Financials are based on the most recent Mortgage that was taken out on this home.
Original Mortgage
$119,600
Interest Rate
5.61%
Mortgage Type
Purchase Money Mortgage
Purchase Details
Closed on
May 27, 2004
Sold by
Bouras Cathy S and Bouras Jeffery M
Bought by
Gaskin Elizabeth
Create a Home Valuation Report for This Property
The Home Valuation Report is an in-depth analysis detailing your home's value as well as a comparison with similar homes in the area
Home Values in the Area
Average Home Value in this Area
Purchase History
| Date | Buyer | Sale Price | Title Company |
|---|---|---|---|
| Stanton Jack L | $166,500 | None Available | |
| Real Estate Enterprises Llc | -- | -- | |
| Gaskin Elizabeth | $97,500 | -- | |
| Bouras Cathy S | -- | -- |
Source: Public Records
Mortgage History
| Date | Status | Borrower | Loan Amount |
|---|---|---|---|
| Open | Stanton Jack L | $150,300 | |
| Closed | Stanton Jack L | $20,000 | |
| Closed | Stanton Jack L | $158,175 | |
| Previous Owner | Womack Matthew A | $167,500 | |
| Previous Owner | Real Estate Enterprises Llc | $119,600 |
Source: Public Records
Tax History Compared to Growth
Tax History
| Year | Tax Paid | Tax Assessment Tax Assessment Total Assessment is a certain percentage of the fair market value that is determined by local assessors to be the total taxable value of land and additions on the property. | Land | Improvement |
|---|---|---|---|---|
| 2024 | $837 | $9,210 | $1,000 | $8,210 |
| 2023 | $709 | $6,645 | $1,000 | $5,645 |
| 2022 | $802 | $6,645 | $1,000 | $5,645 |
| 2021 | $871 | $6,650 | $0 | $0 |
| 2020 | $783 | $6,650 | $0 | $0 |
| 2019 | $730 | $6,645 | $1,000 | $5,645 |
| 2018 | $690 | $6,650 | $0 | $0 |
| 2017 | $654 | $6,650 | $0 | $0 |
| 2016 | $607 | $6,650 | $0 | $0 |
| 2015 | $634 | $6,650 | $0 | $0 |
| 2014 | $548 | $6,645 | $1,000 | $5,645 |
Source: Public Records
Map
Nearby Homes
- 1311 Queens Ferry Rd
- 1810 Brigadoone Ln
- 2117 Sanderling Dr Unit F
- 1815 Hampton Dr
- 1311 Pinckney Ave
- 1770 Woods Dr
- 1110 3rd Loop Rd
- 2125 Sanderling Dr
- 1114 Third Loop D
- 1189 Waxwing Dr
- 2248 Hibernian Dr
- 1031 W Hill Dr
- 2203 Hibernian Dr
- 1947 Horlbeck St
- 1175 Berkley Ave
- 1507 Hampton Dr
- 1903 Winterwood Rd
- 1714 2nd Loop Rd
- 1392 2nd Loop Rd
- 1801 Furman Dr
- 1251 Canterbury Rd
- 1255 Canterbury Rd
- 1831 Nottingham Dr
- 1227 Canterbury Rd
- 1250 Canterbury Rd
- 1259 Canterbury Rd
- 1830 Marsh Ave
- 1220 W Morningside Rd
- 1827 Nottingham Dr
- 1900 Marsh Ave
- 1226 Canterbury Rd
- 1223 Canterbury Rd
- 1826 Marsh Ave
- 1905 Nottingham Dr
- 1216 W Morningside Rd
- 1823 Nottingham Dr
- 1906 Marsh Ave
- 1222 Canterbury Rd
- 1219 Canterbury Rd
- 1301 Canterbury Rd