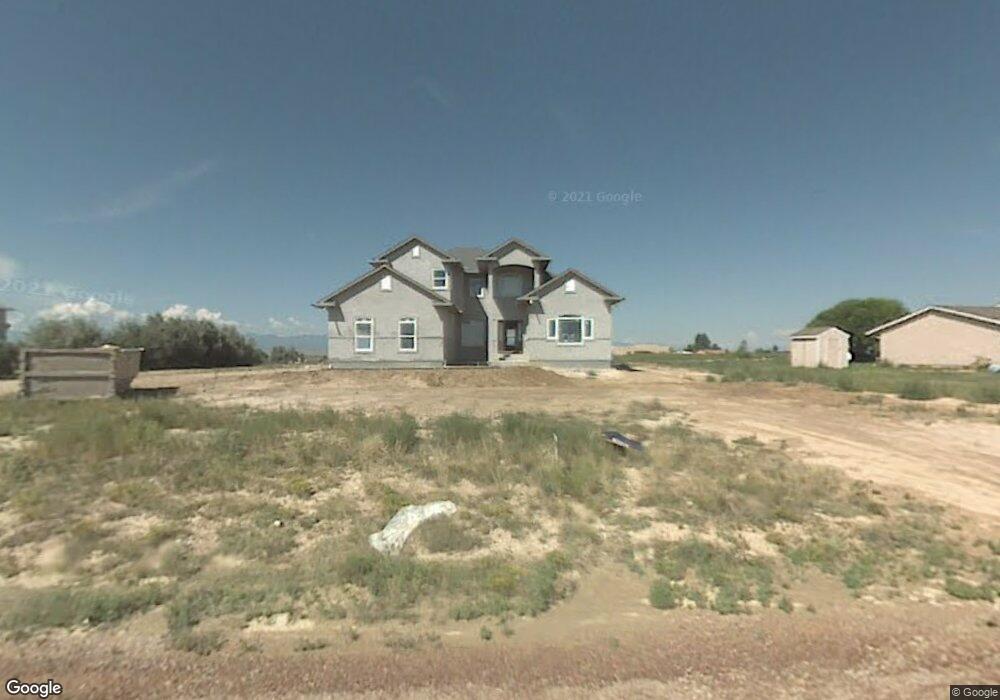
1251 S Thoreau Place Unit 20 Pueblo, CO 81007
Estimated Value: $488,000 - $575,000
5
Beds
4
Baths
2,578
Sq Ft
$204/Sq Ft
Est. Value
About This Home
This home is located at 1251 S Thoreau Place Unit 20, Pueblo, CO 81007 and is currently estimated at $525,132, approximately $203 per square foot. 1251 S Thoreau Place Unit 20 is a home located in Pueblo County with nearby schools including Desert Sage Elementary School, Sky View Middle School, and Pueblo West High School.
Ownership History
Date
Name
Owned For
Owner Type
Purchase Details
Closed on
Aug 31, 2007
Sold by
Iroc Homes Inc
Bought by
Campos Christopher and Campos Teresa
Current Estimated Value
Home Financials for this Owner
Home Financials are based on the most recent Mortgage that was taken out on this home.
Original Mortgage
$208,000
Outstanding Balance
$132,700
Interest Rate
6.72%
Mortgage Type
New Conventional
Estimated Equity
$392,432
Purchase Details
Closed on
Jan 15, 2007
Sold by
Stienike Timothy L and Stienike Stacey E
Bought by
Iroc Homes Inc
Purchase Details
Closed on
Dec 28, 2005
Sold by
Gabrysch Hyacinth
Bought by
Stienike Timothy L and Stienike Stacey E
Purchase Details
Closed on
Apr 24, 1989
Sold by
Mobley Patricia D
Bought by
Gabrysch Hyacinth
Purchase Details
Closed on
Feb 17, 1988
Sold by
Gabrysch Jack H + Hyacinth
Bought by
Mobley Patricia D
Purchase Details
Closed on
May 16, 1983
Sold by
Lawyers Title Of Pueblo Tr
Bought by
Gabrysch Jack H + Hyacinth
Create a Home Valuation Report for This Property
The Home Valuation Report is an in-depth analysis detailing your home's value as well as a comparison with similar homes in the area
Home Values in the Area
Average Home Value in this Area
Purchase History
| Date | Buyer | Sale Price | Title Company |
|---|---|---|---|
| Campos Christopher | $260,000 | Land Title Guarantee Company | |
| Iroc Homes Inc | $38,000 | Security Title | |
| Stienike Timothy L | $27,500 | Fahtco | |
| Gabrysch Hyacinth | $14,200 | -- | |
| Mobley Patricia D | -- | -- | |
| Gabrysch Jack H + Hyacinth | $8,600 | -- |
Source: Public Records
Mortgage History
| Date | Status | Borrower | Loan Amount |
|---|---|---|---|
| Open | Campos Christopher | $208,000 |
Source: Public Records
Tax History Compared to Growth
Tax History
| Year | Tax Paid | Tax Assessment Tax Assessment Total Assessment is a certain percentage of the fair market value that is determined by local assessors to be the total taxable value of land and additions on the property. | Land | Improvement |
|---|---|---|---|---|
| 2024 | $2,850 | $28,410 | -- | -- |
| 2023 | $2,883 | $32,100 | $4,960 | $27,140 |
| 2022 | $2,338 | $23,300 | $3,060 | $20,240 |
| 2021 | $2,397 | $23,970 | $3,150 | $20,820 |
| 2020 | $2,330 | $23,970 | $3,150 | $20,820 |
| 2019 | $2,323 | $23,249 | $1,430 | $21,819 |
| 2018 | $2,118 | $21,183 | $1,440 | $19,743 |
| 2017 | $2,120 | $21,183 | $1,440 | $19,743 |
| 2016 | $2,001 | $20,022 | $1,831 | $18,191 |
| 2015 | $1,984 | $20,022 | $1,831 | $18,191 |
| 2014 | $1,848 | $18,629 | $1,831 | $16,798 |
Source: Public Records
Map
Nearby Homes
- 712 W Mcculloch Blvd
- 1071 S Mcculloch Way
- 894 W Garcia Ct
- 1003 S Quantico Dr
- 437 W Pepper Tree Way
- 1144 S Mcculloch Blvd W
- 846 S Bellflower Dr Unit 848
- 977 S Harmony Dr Unit 979
- 977 S Harmony Dr Unit 977 & 979
- 941 S Harmony Dr
- 1164 S Oakleaf Dr
- 886 S Camino de Bravo
- 321 W Linden Ave
- 822 S Espanola Dr
- 660 W Capistrano Ave
- 324 W Scarsboro Dr
- 351 W Hazelnut Way Unit 353
- 780 S Honeydew Dr
- 784 S Honeydew Dr
- 349 W Buttercup Way
- 1251 S Thoreau Place
- 1243 S Thoreau Place
- 1259 S Thoreau Place
- 1235 S Thoreau Place
- 1235 S Thoreau Place Unit 22
- 1266 S Thoreau Place
- 1254 S Thoreau Place Unit 10
- 1254 S Thoreau Place
- 1267 S Thoreau Place
- 1242 S Thoreau Place Unit 10
- 1242 S Thoreau Place Unit 11
- 1242 S Thoreau Place
- 1230 S Thoreau Place
- 1250 S Yerba Santa Dr
- 1227 S Thoreau Place
- 0 S Thoreau Place Unit 20
- 1268 S Yerba Santa Dr
- 1285 S Thoreau Place
- 1253 S Yerba Santa Dr Unit 7
- 1218 S Thoreau Place