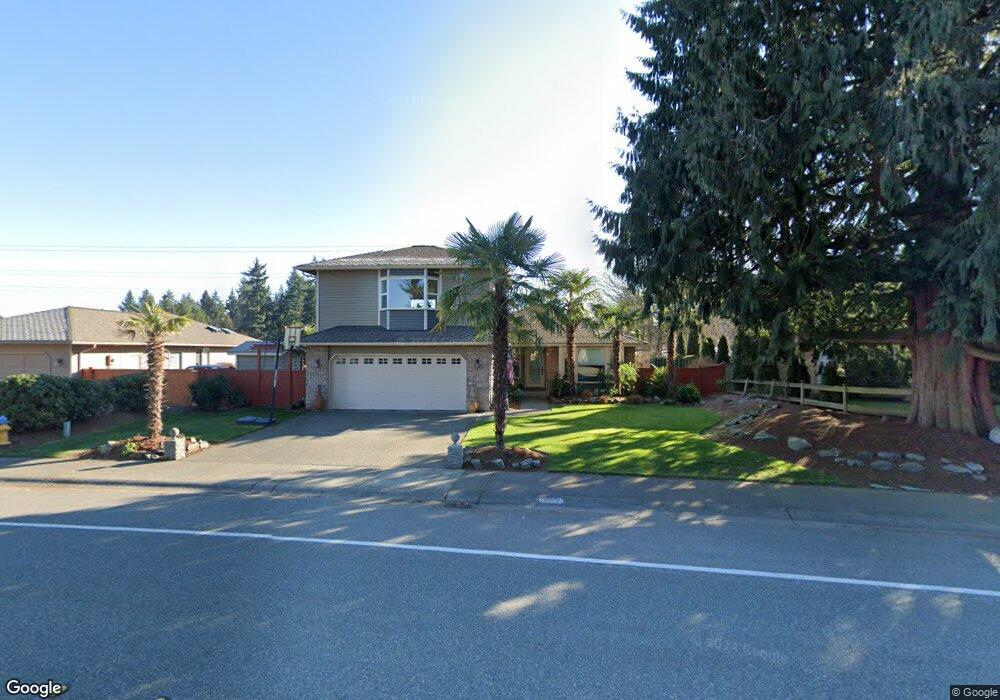
12511 45th Ave SE Everett, WA 98208
Silver Lake NeighborhoodEstimated Value: $794,832 - $878,000
3
Beds
2
Baths
3,660
Sq Ft
$229/Sq Ft
Est. Value
About This Home
This home is located at 12511 45th Ave SE, Everett, WA 98208 and is currently estimated at $837,958, approximately $228 per square foot. 12511 45th Ave SE is a home located in Snohomish County with nearby schools including Penny Creek Elementary School, Eisenhower Middle School, and Cascade High School.
Ownership History
Date
Name
Owned For
Owner Type
Purchase Details
Closed on
Nov 15, 2023
Sold by
Murphy Michael David and Murphy Shanda
Bought by
Murphy Michael D
Current Estimated Value
Purchase Details
Closed on
Oct 1, 2022
Sold by
Murphy Mrs Shanda
Bought by
Murphy Mr Michael Davi
Purchase Details
Closed on
Jan 11, 2000
Sold by
Heiser Phillip Warren and Heiser Wendy Jo
Bought by
Murphy Michael D and Murphy Shanda M
Home Financials for this Owner
Home Financials are based on the most recent Mortgage that was taken out on this home.
Original Mortgage
$179,100
Interest Rate
7.62%
Purchase Details
Closed on
May 28, 1996
Sold by
Eggers Greg and Eggers Kersten
Bought by
Heiser Phillip Warren and Heiser Wendy Jo
Home Financials for this Owner
Home Financials are based on the most recent Mortgage that was taken out on this home.
Original Mortgage
$136,300
Interest Rate
7.97%
Create a Home Valuation Report for This Property
The Home Valuation Report is an in-depth analysis detailing your home's value as well as a comparison with similar homes in the area
Home Values in the Area
Average Home Value in this Area
Purchase History
| Date | Buyer | Sale Price | Title Company |
|---|---|---|---|
| Murphy Michael D | $313 | None Listed On Document | |
| Murphy Mr Michael Davi | -- | -- | |
| Murphy Michael D | -- | -- | |
| Heiser Phillip Warren | $151,450 | Transnation Title Insurance |
Source: Public Records
Mortgage History
| Date | Status | Borrower | Loan Amount |
|---|---|---|---|
| Previous Owner | Murphy Michael D | $179,100 | |
| Previous Owner | Heiser Phillip Warren | $136,300 |
Source: Public Records
Tax History
| Year | Tax Paid | Tax Assessment Tax Assessment Total Assessment is a certain percentage of the fair market value that is determined by local assessors to be the total taxable value of land and additions on the property. | Land | Improvement |
|---|---|---|---|---|
| 2026 | $6,765 | $766,000 | $451,300 | $314,700 |
| 2025 | $6,750 | $733,800 | $427,500 | $306,300 |
| 2024 | $6,750 | $741,500 | $357,000 | $384,500 |
| 2023 | $7,008 | $820,200 | $441,800 | $378,400 |
| 2022 | $5,991 | $613,300 | $289,800 | $323,500 |
| 2020 | $6,156 | $506,600 | $228,000 | $278,600 |
| 2019 | $5,498 | $452,400 | $203,300 | $249,100 |
| 2018 | $5,530 | $419,400 | $197,600 | $221,800 |
| 2017 | $4,814 | $364,700 | $156,800 | $207,900 |
| 2016 | $4,202 | $333,900 | $137,800 | $196,100 |
| 2015 | $4,543 | $344,000 | $128,300 | $215,700 |
| 2013 | $4,334 | $290,700 | $109,300 | $181,400 |
Source: Public Records
Map
Nearby Homes
- 12326 45th Ave SE
- 5018 126th St SE
- 4033 120th Place SE
- 13011 Seattle Hill Rd
- 11710 43rd Dr SE
- 12131 53rd Ave SE
- 13405 45th Dr SE Unit 3
- 5231 131st St SE
- 12325 55th Dr SE
- 4305 136th St SE
- 3613 130th Place SE
- 13530 43rd Ave SE
- 13504 49th Ave SE
- 3510 129th Place SE
- 13609 46th Ave SE
- 11420 51st Ave SE
- 11408 51st Ave SE
- 3328 124th St SE
- 13601 49th Ave SE
- 11527 52nd Ave SE
- 12505 45th Ave SE
- 12515 45th Ave SE
- 12433 45th Ave SE
- 12519 45th Ave SE
- 12510 45th Ave SE
- 12504 45th Ave SE
- 12516 45th Ave SE
- 12427 45th Ave SE
- 12512 46th Dr SE
- 12504 46th Dr SE
- 12430 45th Ave SE
- 12520 46th Dr SE
- 4529 126th St SE
- 12432 46th Dr SE
- 4517 126th St SE
- 12522 45th Ave SE
- 12526 46th Dr SE
- 12426 46th Dr SE
- 12426 45th Ave SE
- 12513 44th Dr SE
Your Personal Tour Guide
Ask me questions while you tour the home.