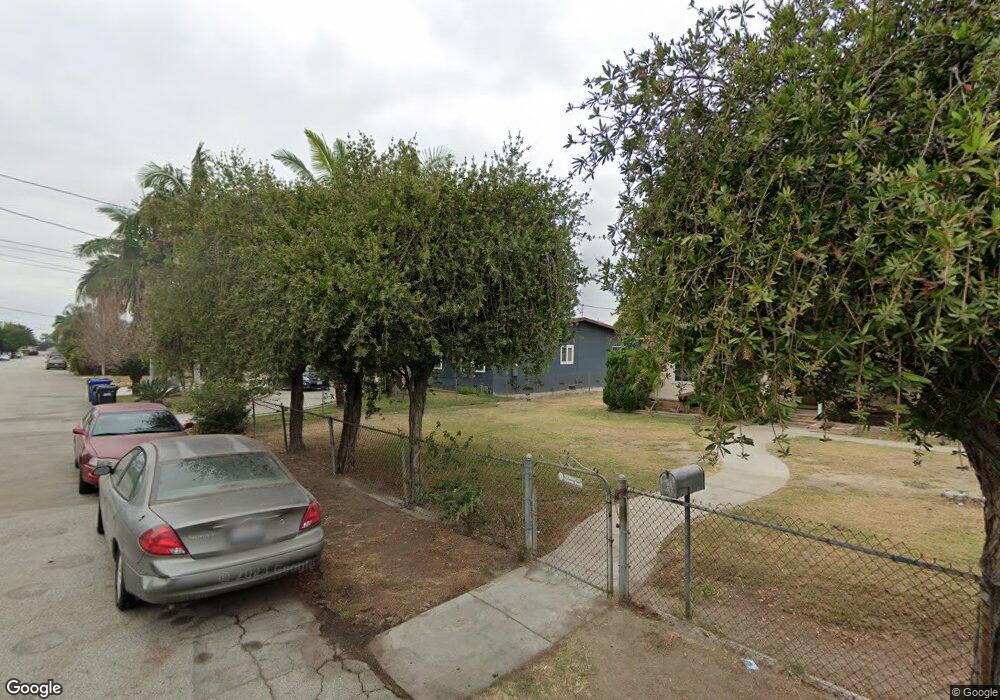
12515 Dolan Ave Downey, CA 90242
Estimated Value: $1,070,000 - $1,420,000
5
Beds
3
Baths
2,225
Sq Ft
$545/Sq Ft
Est. Value
About This Home
This home is located at 12515 Dolan Ave, Downey, CA 90242 and is currently estimated at $1,212,940, approximately $545 per square foot. 12515 Dolan Ave is a home located in Los Angeles County with nearby schools including Alameda Elementary School, Carpenter Elementary School, and Sussman Middle School.
Ownership History
Date
Name
Owned For
Owner Type
Purchase Details
Closed on
Apr 17, 2002
Sold by
Khosravy Davood and Khosravy Barbara L
Bought by
Rezazadeh Alireza
Current Estimated Value
Home Financials for this Owner
Home Financials are based on the most recent Mortgage that was taken out on this home.
Original Mortgage
$268,000
Outstanding Balance
$113,632
Interest Rate
7.13%
Estimated Equity
$1,099,308
Purchase Details
Closed on
Nov 3, 1994
Sold by
Beneficial California Inc
Bought by
Khosravy Davood
Home Financials for this Owner
Home Financials are based on the most recent Mortgage that was taken out on this home.
Original Mortgage
$203,150
Interest Rate
9.16%
Purchase Details
Closed on
Oct 4, 1994
Sold by
Morsi Saifelislam Hassan and Morsi Fatma
Bought by
Beneficial California Inc
Home Financials for this Owner
Home Financials are based on the most recent Mortgage that was taken out on this home.
Original Mortgage
$203,150
Interest Rate
9.16%
Create a Home Valuation Report for This Property
The Home Valuation Report is an in-depth analysis detailing your home's value as well as a comparison with similar homes in the area
Home Values in the Area
Average Home Value in this Area
Purchase History
| Date | Buyer | Sale Price | Title Company |
|---|---|---|---|
| Rezazadeh Alireza | $335,000 | Commerce Title | |
| Khosravy Davood | $233,000 | Chicago Title | |
| Beneficial California Inc | $118,922 | Benefit Land Title Co |
Source: Public Records
Mortgage History
| Date | Status | Borrower | Loan Amount |
|---|---|---|---|
| Open | Rezazadeh Alireza | $268,000 | |
| Previous Owner | Khosravy Davood | $203,150 | |
| Closed | Rezazadeh Alireza | $33,500 |
Source: Public Records
Tax History Compared to Growth
Tax History
| Year | Tax Paid | Tax Assessment Tax Assessment Total Assessment is a certain percentage of the fair market value that is determined by local assessors to be the total taxable value of land and additions on the property. | Land | Improvement |
|---|---|---|---|---|
| 2025 | $6,442 | $494,874 | $315,834 | $179,040 |
| 2024 | $6,442 | $485,172 | $309,642 | $175,530 |
| 2023 | $6,231 | $475,660 | $303,571 | $172,089 |
| 2022 | $5,930 | $466,334 | $297,619 | $168,715 |
| 2021 | $5,796 | $457,191 | $291,784 | $165,407 |
| 2019 | $5,651 | $443,632 | $283,131 | $160,501 |
| 2018 | $5,348 | $434,934 | $277,580 | $157,354 |
| 2016 | $5,175 | $418,047 | $266,802 | $151,245 |
| 2015 | $5,102 | $411,769 | $262,795 | $148,974 |
| 2014 | $4,823 | $403,704 | $257,648 | $146,056 |
Source: Public Records
Map
Nearby Homes
- 12566 Dolan Ave
- 8426 Orange St
- 0 Orange St
- 12614 Gneiss Ave
- 12350 Brock Ave
- 12143 Downey Ave
- 8231 Comolette St
- 8558 Alameda St
- 8345 Boyne St
- 12124 Anderberg Ave
- 8312 Devenir Ave
- 7939 Lyndora St
- 12917 Sandy Ln
- 12152 Marbel Ave
- 7964 Comolette St
- 12148 Marbel Ave
- 8200 Priscilla St
- 12707 Glenshire Rd
- 12014 Patton Rd
- 7820 Springer St
- 12521 Dolan Ave
- 8406 Everest St
- 12507 Dolan Ave
- 8402 Everest St
- 12531 Dolan Ave
- 8328 Everest St
- 12506 Dolan Ave
- 8322 Everest St
- 8329 Leeds St
- 12537 Dolan Ave
- 12516 Dolan Ave
- 12522 Dolan Ave
- 8325 Leeds St
- 8411 Everest St
- 8419 Everest St
- 8318 Everest St
- 8401 Everest St
- 12530 Dolan Ave
- 8438 Everest St
- 8423 Everest St