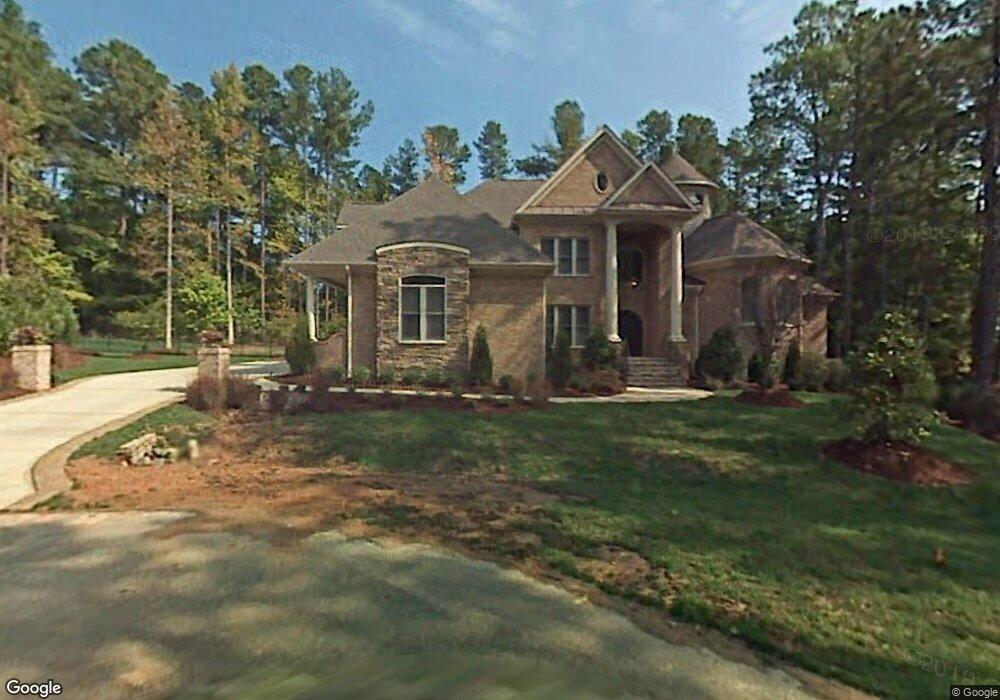
12517 Tuscan Lake Rd Raleigh, NC 27613
Falls Lake NeighborhoodEstimated Value: $1,647,000 - $2,091,000
4
Beds
6
Baths
5,103
Sq Ft
$356/Sq Ft
Est. Value
About This Home
This home is located at 12517 Tuscan Lake Rd, Raleigh, NC 27613 and is currently estimated at $1,816,458, approximately $355 per square foot. 12517 Tuscan Lake Rd is a home located in Wake County with nearby schools including West Millbrook Middle School, Leesville Road High School, and The Franciscan School.
Ownership History
Date
Name
Owned For
Owner Type
Purchase Details
Closed on
Jun 16, 2017
Sold by
Owb Reo Llc
Bought by
Steinmann Kimberly and Steinmann Warren
Current Estimated Value
Home Financials for this Owner
Home Financials are based on the most recent Mortgage that was taken out on this home.
Original Mortgage
$600,000
Interest Rate
3.96%
Mortgage Type
New Conventional
Purchase Details
Closed on
Mar 1, 2017
Sold by
Rattenni Michael and Rattenni Amy
Bought by
Owb Reo Llc
Purchase Details
Closed on
Jun 29, 2007
Sold by
Tuscany Construction Group Inc
Bought by
Rattenni Michael and Rattenni Amy
Home Financials for this Owner
Home Financials are based on the most recent Mortgage that was taken out on this home.
Original Mortgage
$1,120,000
Interest Rate
6.16%
Mortgage Type
Purchase Money Mortgage
Create a Home Valuation Report for This Property
The Home Valuation Report is an in-depth analysis detailing your home's value as well as a comparison with similar homes in the area
Home Values in the Area
Average Home Value in this Area
Purchase History
| Date | Buyer | Sale Price | Title Company |
|---|---|---|---|
| Steinmann Kimberly | $750,000 | None Available | |
| Owb Reo Llc | $856,874 | None Available | |
| Rattenni Michael | $1,500,000 | None Available |
Source: Public Records
Mortgage History
| Date | Status | Borrower | Loan Amount |
|---|---|---|---|
| Previous Owner | Steinmann Kimberly | $600,000 | |
| Previous Owner | Rattenni Michael | $1,120,000 | |
| Previous Owner | Rattenni Michael | $150,000 |
Source: Public Records
Tax History Compared to Growth
Tax History
| Year | Tax Paid | Tax Assessment Tax Assessment Total Assessment is a certain percentage of the fair market value that is determined by local assessors to be the total taxable value of land and additions on the property. | Land | Improvement |
|---|---|---|---|---|
| 2025 | $10,970 | $1,712,030 | $286,000 | $1,426,030 |
| 2024 | $10,652 | $1,712,030 | $286,000 | $1,426,030 |
| 2023 | $11,116 | $1,423,173 | $247,500 | $1,175,673 |
| 2022 | $10,298 | $1,423,173 | $247,500 | $1,175,673 |
| 2021 | $10,021 | $1,345,203 | $247,500 | $1,097,703 |
| 2020 | $9,315 | $1,345,203 | $247,500 | $1,097,703 |
| 2019 | $9,748 | $1,191,192 | $247,500 | $943,692 |
| 2018 | $9,194 | $1,222,551 | $247,500 | $975,051 |
| 2017 | $8,712 | $1,222,551 | $247,500 | $975,051 |
| 2016 | $8,535 | $1,206,607 | $247,500 | $959,107 |
| 2015 | $10,297 | $1,479,742 | $250,000 | $1,229,742 |
| 2014 | $9,757 | $1,479,742 | $250,000 | $1,229,742 |
Source: Public Records
Map
Nearby Homes
- 10729 Winding Wood Trail
- 10305 Old Creedmoor Rd
- 10101 Lobley Hill Ln
- 8717 Little Deer Ln
- 5965 Dunbarton Way
- 11425 Horsemans Trail
- 5009 Wood Valley Dr
- 3105 Cone Manor Ln
- 5528 Hawthorne Park
- 11804 Mountbatten Way
- 4820 Sandberry Ln
- 11953 Eagle Cliff Ct
- 10029 Old Warden Rd
- 1508 Tradescant Ct
- 12304 Whartons Way
- 5428 Winding View Ln
- 5204 Barton View Ct
- 2409 Loring Ct
- 1300 Caistor Ln
- 5020 Celbridge Place
- 12515 Tuscan Lake Rd
- 12509 Tuscan Lake St
- 12509 Tuscan Lake Rd
- 12509 Tuscan Lake St Unit 8
- 12509 Tuscan Lake Rd Unit 8
- 12921 Barsanlaw Dr
- 12605 Kristy Cir
- 12604 Norwood Rd
- 12601 Kristy Cir
- 10 Tuscan Lake
- Lot 3 Tuscan Lake
- 0 Tuscan Lake Rd Unit 1900198
- 0 Tuscan Lake Rd Unit 7 TR1900198
- 0 Tuscan Lake Rd Unit 7
- 12917 Barsanlaw Dr
- 12505 Tuscan Lake Rd
- 12505 Tuscan Lake Rd Unit 7
- 12505 Tuscan Lake St
- 12505 Tuscan Lake St Unit 7
- 9808 Najma St