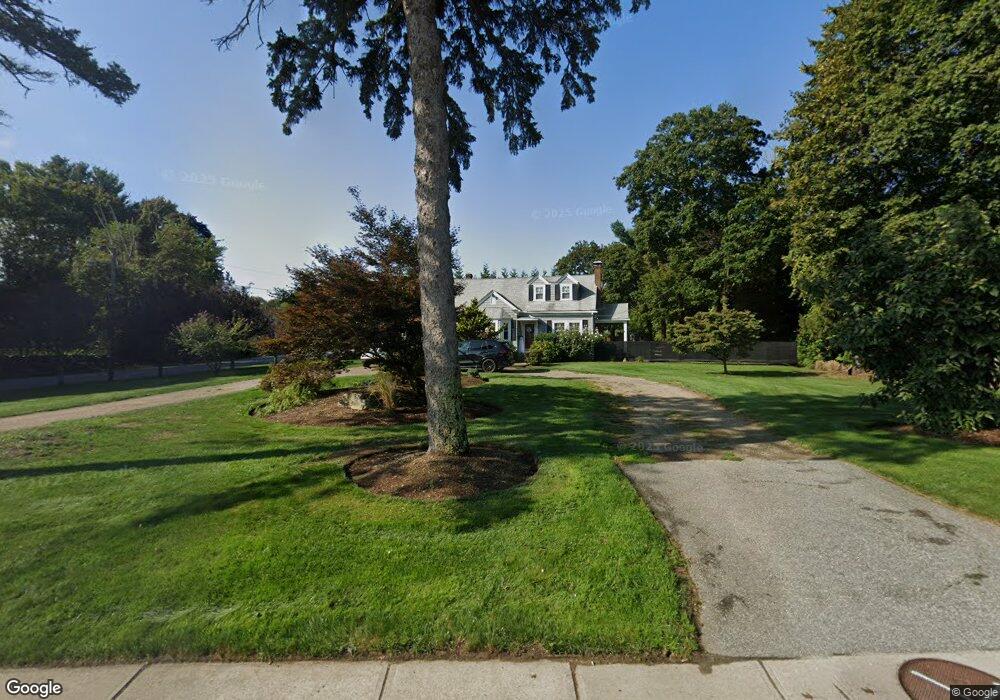
1252 Atwood Ave Johnston, RI 02919
Thornton NeighborhoodEstimated Value: $432,053 - $590,000
3
Beds
1
Bath
1,742
Sq Ft
$290/Sq Ft
Est. Value
About This Home
This home is located at 1252 Atwood Ave, Johnston, RI 02919 and is currently estimated at $506,013, approximately $290 per square foot. 1252 Atwood Ave is a home located in Providence County with nearby schools including Mazomanie Elementary School, Johnston Senior High School, and St Rocco School.
Ownership History
Date
Name
Owned For
Owner Type
Purchase Details
Closed on
Jun 7, 2023
Sold by
Gemma Michael A and Gemma Natalie A
Bought by
Gemma Michael A
Current Estimated Value
Purchase Details
Closed on
Apr 18, 2016
Sold by
Mcdonald Carol and Johnston Town Of
Bought by
Mcdonald Carol
Purchase Details
Closed on
Nov 29, 2011
Sold by
Mcdonald Carol A
Bought by
Gemma Michael A
Create a Home Valuation Report for This Property
The Home Valuation Report is an in-depth analysis detailing your home's value as well as a comparison with similar homes in the area
Home Values in the Area
Average Home Value in this Area
Purchase History
| Date | Buyer | Sale Price | Title Company |
|---|---|---|---|
| Gemma Michael A | -- | None Available | |
| Gemma Michael A | -- | None Available | |
| Gemma Michael A | -- | None Available | |
| Mcdonald Carol | -- | -- | |
| Gemma Michael A | -- | -- | |
| Mcdonald Carol | -- | -- | |
| Gemma Michael A | -- | -- |
Source: Public Records
Tax History Compared to Growth
Tax History
| Year | Tax Paid | Tax Assessment Tax Assessment Total Assessment is a certain percentage of the fair market value that is determined by local assessors to be the total taxable value of land and additions on the property. | Land | Improvement |
|---|---|---|---|---|
| 2025 | $5,275 | $337,700 | $102,900 | $234,800 |
| 2024 | $5,167 | $337,700 | $102,900 | $234,800 |
| 2023 | $5,167 | $337,700 | $102,900 | $234,800 |
| 2022 | $4,481 | $192,800 | $58,400 | $134,400 |
| 2021 | $4,481 | $192,800 | $58,400 | $134,400 |
| 2018 | $4,654 | $169,300 | $50,100 | $119,200 |
| 2016 | $6,157 | $169,300 | $50,100 | $119,200 |
| 2015 | $4,108 | $141,700 | $50,100 | $91,600 |
| 2014 | $4,074 | $141,700 | $50,100 | $91,600 |
| 2013 | $4,074 | $141,700 | $50,100 | $91,600 |
Source: Public Records
Map
Nearby Homes