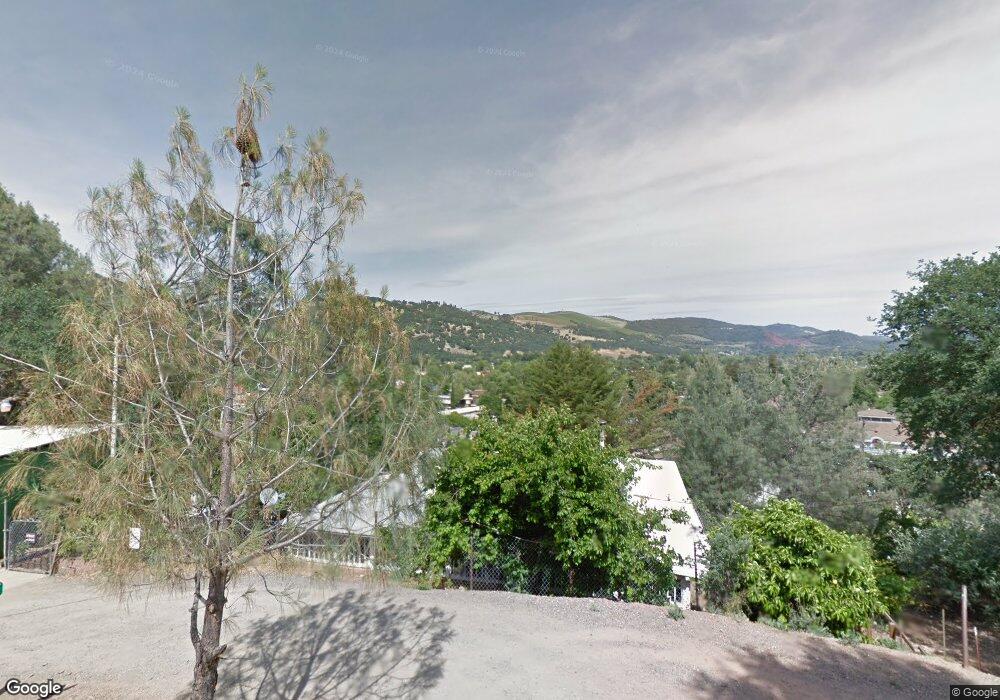
12521 Widgeon Way Clearlake Oaks, CA 95423
Estimated Value: $219,000 - $306,000
2
Beds
2
Baths
1,100
Sq Ft
$234/Sq Ft
Est. Value
About This Home
This home is located at 12521 Widgeon Way, Clearlake Oaks, CA 95423 and is currently estimated at $257,199, approximately $233 per square foot. 12521 Widgeon Way is a home located in Lake County with nearby schools including Lower Lake High School.
Ownership History
Date
Name
Owned For
Owner Type
Purchase Details
Closed on
Nov 30, 2005
Sold by
Noack Gabrielle
Bought by
Noack Carl
Current Estimated Value
Home Financials for this Owner
Home Financials are based on the most recent Mortgage that was taken out on this home.
Original Mortgage
$140,000
Outstanding Balance
$78,424
Interest Rate
6.31%
Mortgage Type
Fannie Mae Freddie Mac
Estimated Equity
$178,775
Purchase Details
Closed on
Nov 29, 2005
Sold by
Grey Jason L and Grey Tonya L
Bought by
Noack Carl
Home Financials for this Owner
Home Financials are based on the most recent Mortgage that was taken out on this home.
Original Mortgage
$140,000
Outstanding Balance
$78,424
Interest Rate
6.31%
Mortgage Type
Fannie Mae Freddie Mac
Estimated Equity
$178,775
Purchase Details
Closed on
Feb 18, 2004
Sold by
Archibald Patricia Karen
Bought by
Grey Jason L and Grey Tonya L
Home Financials for this Owner
Home Financials are based on the most recent Mortgage that was taken out on this home.
Original Mortgage
$106,200
Interest Rate
5.62%
Mortgage Type
Purchase Money Mortgage
Create a Home Valuation Report for This Property
The Home Valuation Report is an in-depth analysis detailing your home's value as well as a comparison with similar homes in the area
Home Values in the Area
Average Home Value in this Area
Purchase History
| Date | Buyer | Sale Price | Title Company |
|---|---|---|---|
| Noack Carl | -- | First American Title | |
| Noack Carl | $175,000 | First American Title | |
| Grey Jason L | $118,000 | Fidelity National Title |
Source: Public Records
Mortgage History
| Date | Status | Borrower | Loan Amount |
|---|---|---|---|
| Open | Noack Carl | $140,000 | |
| Previous Owner | Grey Jason L | $106,200 |
Source: Public Records
Tax History Compared to Growth
Tax History
| Year | Tax Paid | Tax Assessment Tax Assessment Total Assessment is a certain percentage of the fair market value that is determined by local assessors to be the total taxable value of land and additions on the property. | Land | Improvement |
|---|---|---|---|---|
| 2024 | $2,719 | $234,444 | $100,475 | $133,969 |
| 2023 | $2,689 | $229,848 | $98,505 | $131,343 |
| 2022 | $2,559 | $225,342 | $96,574 | $128,768 |
| 2021 | $888 | $70,000 | $40,000 | $30,000 |
| 2020 | $892 | $70,000 | $40,000 | $30,000 |
| 2019 | $872 | $70,000 | $40,000 | $30,000 |
| 2018 | $889 | $70,000 | $40,000 | $30,000 |
| 2017 | $864 | $70,000 | $40,000 | $30,000 |
| 2016 | $843 | $70,000 | $40,000 | $30,000 |
| 2015 | $840 | $70,000 | $40,000 | $30,000 |
| 2014 | $839 | $70,000 | $40,000 | $30,000 |
Source: Public Records
Map
Nearby Homes
- 12441 Pine St
- 12618 Foothill Blvd
- 12546 Foothill Blvd
- 12630 Shoreview Dr
- 12453 Widgeon Way
- 12474 The Plaza
- 12330 Lakeview Dr
- 12484 The Plaza
- 12410 Lakeview Dr
- 12773 Island Cir
- 11860 Lakeview Dr
- 12504 Lakeview Dr
- 12508 Lakeview Dr
- 12115 Lakeview Dr
- 11725 Lakeview Dr
- 11705 Lakeview Dr
- 12331 Oakgrove Ave
- 12741 Blue Heron Ct
- 12415 Mount View Dr
- 12755 Blue Heron Ct
- 12536 E Highway 20
- 12511 Widgeon Way
- 12540 E Highway 20
- 12522 E Highway 20
- 12508 Widgeon Way
- 12509 Widgeon Way
- 12548 Pine St
- 12496 Manzanita Ct
- 12530 Widgeon Way
- 12556 Pine St
- 12552 Pine St
- 12495 Manzanita Ct
- 12516 Ca-20
- 12537 Widgeon Way
- 12516 E Highway 20
- 24368 California 20
- 12595 E Highway 20
- 12570 E Highway 20
- 12562 Pine St
- 12520 Shady Ln