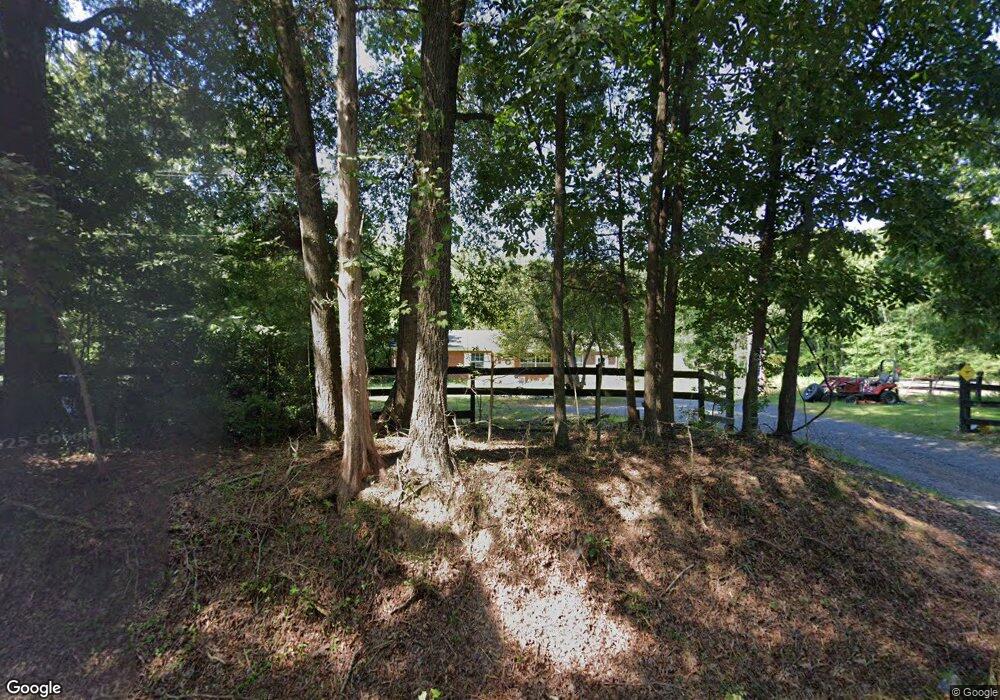
12526 Elk Run Rd Midland, VA 22728
Estimated Value: $438,201 - $486,000
3
Beds
1
Bath
1,425
Sq Ft
$329/Sq Ft
Est. Value
About This Home
This home is located at 12526 Elk Run Rd, Midland, VA 22728 and is currently estimated at $468,550, approximately $328 per square foot. 12526 Elk Run Rd is a home located in Fauquier County with nearby schools including Mary Walter Elementary School, Cedar Lee Middle School, and Liberty High School.
Ownership History
Date
Name
Owned For
Owner Type
Purchase Details
Closed on
Nov 19, 2009
Sold by
Faylor Robert E
Bought by
Dye Benjamin
Current Estimated Value
Home Financials for this Owner
Home Financials are based on the most recent Mortgage that was taken out on this home.
Original Mortgage
$220,826
Outstanding Balance
$143,155
Interest Rate
4.86%
Mortgage Type
FHA
Estimated Equity
$325,395
Purchase Details
Closed on
May 21, 2009
Sold by
Hsbc Bank Usa N A As Trus
Bought by
Faylor Robert E
Purchase Details
Closed on
Nov 11, 2008
Sold by
Specilized Inc
Bought by
Hsbc Bank Usa
Purchase Details
Closed on
May 27, 2005
Sold by
Gerber Robert
Bought by
Croson Clay
Home Financials for this Owner
Home Financials are based on the most recent Mortgage that was taken out on this home.
Original Mortgage
$297,000
Interest Rate
5.94%
Mortgage Type
New Conventional
Create a Home Valuation Report for This Property
The Home Valuation Report is an in-depth analysis detailing your home's value as well as a comparison with similar homes in the area
Home Values in the Area
Average Home Value in this Area
Purchase History
| Date | Buyer | Sale Price | Title Company |
|---|---|---|---|
| Dye Benjamin | $224,900 | -- | |
| Faylor Robert E | $155,500 | -- | |
| Hsbc Bank Usa | $131,350 | -- | |
| Croson Clay | $350,000 | -- |
Source: Public Records
Mortgage History
| Date | Status | Borrower | Loan Amount |
|---|---|---|---|
| Open | Dye Benjamin | $220,826 | |
| Previous Owner | Croson Clay | $297,000 |
Source: Public Records
Tax History Compared to Growth
Tax History
| Year | Tax Paid | Tax Assessment Tax Assessment Total Assessment is a certain percentage of the fair market value that is determined by local assessors to be the total taxable value of land and additions on the property. | Land | Improvement |
|---|---|---|---|---|
| 2025 | $3,102 | $320,800 | $116,000 | $204,800 |
| 2024 | $3,039 | $320,800 | $116,000 | $204,800 |
| 2023 | $2,910 | $320,800 | $116,000 | $204,800 |
| 2022 | $2,910 | $320,800 | $116,000 | $204,800 |
| 2021 | $2,596 | $259,800 | $101,000 | $158,800 |
| 2020 | $2,596 | $259,800 | $101,000 | $158,800 |
| 2019 | $2,596 | $259,800 | $101,000 | $158,800 |
| 2018 | $2,565 | $259,800 | $101,000 | $158,800 |
| 2016 | $2,308 | $220,800 | $94,300 | $126,500 |
| 2015 | -- | $220,800 | $94,300 | $126,500 |
| 2014 | -- | $220,800 | $94,300 | $126,500 |
Source: Public Records
Map
Nearby Homes
- 3587 Monarch Ln
- 3584 Ensors Shop Rd
- 000 Old Mill Rd
- 4249 Midland Rd
- 0 Courtney School Rd
- 3326 Courtney School Rd
- 12586 Lake Coventry Dr
- 12587 Lake Coventry Dr
- 13328 Elk Run Rd
- 11243 Blackwelltown Rd
- 11312 Timbuktu Ln
- 13075 Blackwood Forest Dr
- 00 Baines Corner Rd
- 11378 Timbuktu Ln
- 0 Marsh Rd Unit VAFQ2019648
- 0 Rt 17 and Inglewood Farm Ln Unit VAFQ2016840
- 2012 Dozer Ln
- 13200 Marsh Rd
- 11326-BUILD SOUTH Rogues Rd
- The Rockford Plan at Riverbend Estates
- 12542 Elk Run Rd
- 12523 Elk Run Rd
- 12539 Elk Run Rd
- 12500 Elk Run Rd
- 12516 Elk Run Rd
- 12552 Elk Run Rd
- 12550 Elk Run Rd
- 12514 Elk Run Rd
- 12490 Elk Run Rd
- 12553 Elk Run Rd
- 12493 Elk Run Rd
- 0 Elk Run Rd Unit 1007601978
- 0 Elk Run Rd Unit 1007601948
- 0 Elk Run Rd Unit 1007599278
- 0 Elk Run Rd Unit 1007598684
- 0 Elk Run Rd Unit 1010002796
- 0 Elk Run Rd Unit VAFQ2013556
- 0 Elk Run Rd Unit VAFQ2012076
- 0 Elk Run Rd Unit FQ6555979
- 0 Elk Run Rd Unit FQ8290080