Estimated Value: $722,368 - $789,000
3
Beds
2
Baths
1,558
Sq Ft
$480/Sq Ft
Est. Value
About This Home
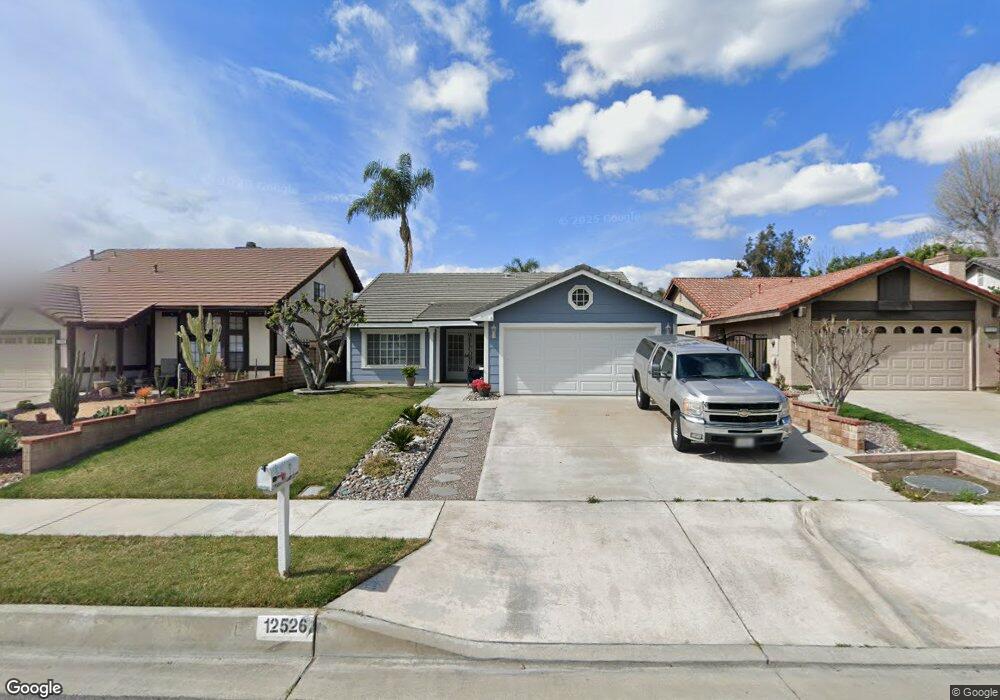
This home is located at 12526 Fern Ave, Chino, CA 91710 and is currently estimated at $747,342, approximately $479 per square foot. 12526 Fern Ave is a home located in San Bernardino County with nearby schools including Alicia Cortez Elementary, Magnolia Junior High, and Chino High School.
Ownership History
Date
Name
Owned For
Owner Type
Purchase Details
Closed on
Jan 28, 2009
Sold by
Selvidge Mark
Bought by
Selvidge Mark D and Selvidge Gina M
Current Estimated Value
Home Financials for this Owner
Home Financials are based on the most recent Mortgage that was taken out on this home.
Original Mortgage
$230,000
Outstanding Balance
$145,699
Interest Rate
5.14%
Mortgage Type
New Conventional
Estimated Equity
$601,643
Purchase Details
Closed on
Apr 8, 2002
Sold by
Selvidge Gina M
Bought by
Selvidge Mark
Home Financials for this Owner
Home Financials are based on the most recent Mortgage that was taken out on this home.
Original Mortgage
$32,000
Interest Rate
6.78%
Purchase Details
Closed on
Oct 9, 1996
Sold by
Dubois Conrad J
Bought by
Selvidge Mark
Home Financials for this Owner
Home Financials are based on the most recent Mortgage that was taken out on this home.
Original Mortgage
$149,150
Interest Rate
8.14%
Create a Home Valuation Report for This Property
The Home Valuation Report is an in-depth analysis detailing your home's value as well as a comparison with similar homes in the area
Home Values in the Area
Average Home Value in this Area
Purchase History
| Date | Buyer | Sale Price | Title Company |
|---|---|---|---|
| Selvidge Mark D | -- | First American Lenders Advan | |
| Selvidge Mark | -- | First American Title Ins Co | |
| Selvidge Mark | $157,000 | Chicago Title Co |
Source: Public Records
Mortgage History
| Date | Status | Borrower | Loan Amount |
|---|---|---|---|
| Open | Selvidge Mark D | $230,000 | |
| Closed | Selvidge Mark | $32,000 | |
| Closed | Selvidge Mark | $149,150 |
Source: Public Records
Tax History Compared to Growth
Tax History
| Year | Tax Paid | Tax Assessment Tax Assessment Total Assessment is a certain percentage of the fair market value that is determined by local assessors to be the total taxable value of land and additions on the property. | Land | Improvement |
|---|---|---|---|---|
| 2025 | $2,732 | $255,700 | $64,007 | $191,693 |
| 2024 | $2,732 | $250,686 | $62,752 | $187,934 |
| 2023 | $2,656 | $245,771 | $61,522 | $184,249 |
| 2022 | $2,639 | $240,952 | $60,316 | $180,636 |
| 2021 | $2,586 | $236,227 | $59,133 | $177,094 |
| 2020 | $2,552 | $233,805 | $58,527 | $175,278 |
| 2019 | $2,507 | $229,220 | $57,379 | $171,841 |
| 2018 | $2,451 | $224,726 | $56,254 | $168,472 |
| 2017 | $2,406 | $220,320 | $55,151 | $165,169 |
| 2016 | $2,249 | $216,000 | $54,070 | $161,930 |
| 2015 | $2,203 | $212,756 | $53,258 | $159,498 |
| 2014 | $2,159 | $208,589 | $52,215 | $156,374 |
Source: Public Records
Map
Nearby Homes
- 12482 Silkleaf Ave
- 12476 Park Ave
- 320 W Walnut St Unit 6
- 6763 Poinsettia Ct
- 6703 Poinsettia Ct
- 6703 Aster Ct
- 6736 Aster Ct
- 209 W Via Rua Flores
- 2890 S Via Belamaria
- 2350 S Via Esplanade Unit 31
- 6766 Foxcroft Ct
- 2333 S Via Esplanade Unit 29
- 2333 S Via Esplanade Unit 25
- 12834 Zinnea Ave
- 6542 Hamilton St
- 2343 S Via Veranda Unit 10
- 12689 Cypress Ave
- 6630 Mogano Dr
- 6648 Riverside Dr Unit 3
- 558 W Philadelphia St
- 12518 Fern Ave
- 12534 Fern Ave
- 6865 Eisenhower Ct
- 12510 Fern Ave
- 12542 Fern Ave
- 6862 Eisenhower Ct
- 12550 Fern Ave
- 12502 Fern Ave
- 6855 Eisenhower Ct
- 2615 S Fern Ave
- 2621 S Fern Ave
- 2609 S Fern Ave
- 12550 Sterling Place
- 12558 Fern Ave
- 2627 S Fern Ave
- 6852 Eisenhower Ct
- 12540 Sterling Place
- 2603 S Fern Ave
- 6845 Eisenhower Ct
- 2633 S Fern Ave