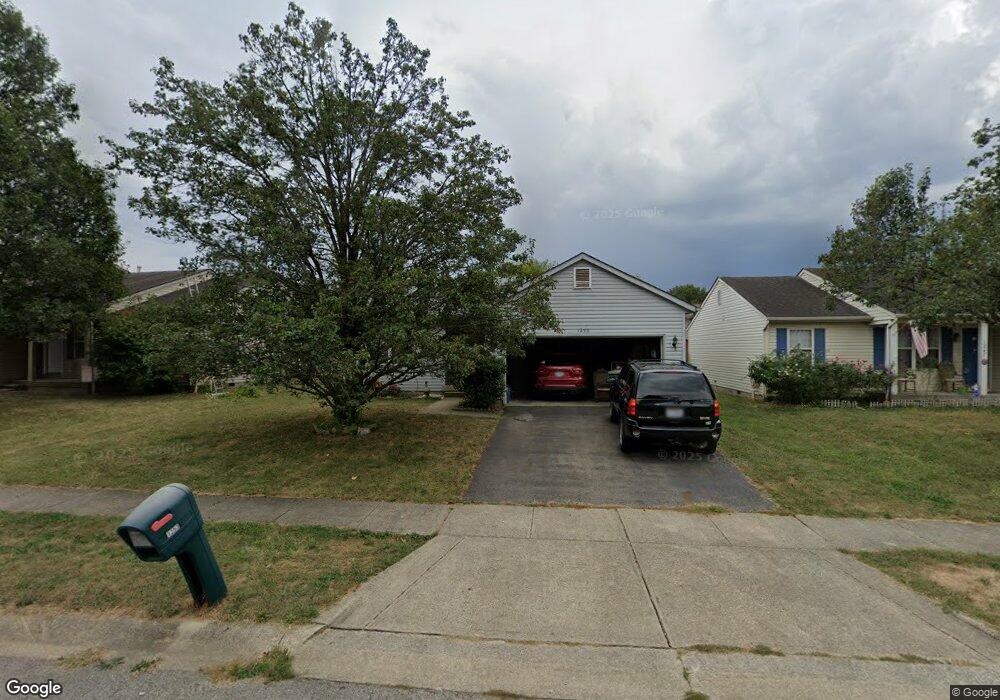
1253 Caravel Dr Columbus, OH 43207
Obetz-Lockbourne NeighborhoodEstimated Value: $191,000 - $244,000
3
Beds
2
Baths
1,038
Sq Ft
$217/Sq Ft
Est. Value
About This Home
This home is located at 1253 Caravel Dr, Columbus, OH 43207 and is currently estimated at $225,127, approximately $216 per square foot. 1253 Caravel Dr is a home located in Franklin County with nearby schools including Hamilton Elementary School, Hamilton Intermediate School, and Hamilton Middle School.
Ownership History
Date
Name
Owned For
Owner Type
Purchase Details
Closed on
Sep 7, 2021
Sold by
Collins Willis
Bought by
Collins Willis and Paxton Elizabeth Marie
Current Estimated Value
Home Financials for this Owner
Home Financials are based on the most recent Mortgage that was taken out on this home.
Original Mortgage
$76,500
Interest Rate
3.14%
Mortgage Type
New Conventional
Purchase Details
Closed on
Oct 6, 2000
Sold by
Crossmann Communities Of Ohio Inc
Bought by
Collins Willis and Collins Bonnie L
Home Financials for this Owner
Home Financials are based on the most recent Mortgage that was taken out on this home.
Original Mortgage
$94,836
Interest Rate
8.03%
Mortgage Type
FHA
Create a Home Valuation Report for This Property
The Home Valuation Report is an in-depth analysis detailing your home's value as well as a comparison with similar homes in the area
Home Values in the Area
Average Home Value in this Area
Purchase History
| Date | Buyer | Sale Price | Title Company |
|---|---|---|---|
| Collins Willis | -- | Accommodation | |
| Collins Willis | $94,900 | Chicago Title West |
Source: Public Records
Mortgage History
| Date | Status | Borrower | Loan Amount |
|---|---|---|---|
| Closed | Collins Willis | $76,500 | |
| Closed | Collins Willis | $94,836 |
Source: Public Records
Tax History
| Year | Tax Paid | Tax Assessment Tax Assessment Total Assessment is a certain percentage of the fair market value that is determined by local assessors to be the total taxable value of land and additions on the property. | Land | Improvement |
|---|---|---|---|---|
| 2025 | $2,318 | $69,930 | $22,050 | $47,880 |
| 2024 | $2,318 | $69,930 | $22,050 | $47,880 |
| 2023 | $2,304 | $69,930 | $22,050 | $47,880 |
| 2022 | $1,306 | $40,050 | $8,230 | $31,820 |
| 2021 | $1,328 | $40,050 | $8,230 | $31,820 |
| 2020 | $1,358 | $40,050 | $8,230 | $31,820 |
| 2019 | $1,192 | $33,810 | $6,860 | $26,950 |
| 2018 | $1,667 | $33,810 | $6,860 | $26,950 |
| 2017 | $1,627 | $33,810 | $6,860 | $26,950 |
| 2016 | $1,714 | $33,320 | $7,280 | $26,040 |
| 2015 | $1,736 | $33,320 | $7,280 | $26,040 |
| 2014 | $1,742 | $33,320 | $7,280 | $26,040 |
| 2013 | $893 | $35,070 | $7,665 | $27,405 |
Source: Public Records
Map
Nearby Homes
- 4412 Catamaran Dr
- 1132 Ayrshire Dr
- 1067 Rendezvous Ln
- 4241 Gelbray Ct
- 1122 Viewpointe Dr
- 1062 Viewpointe Dr
- 4451 1/2 Lockbourne Rd Unit R
- 1101 Meadow Ln
- 1041 Meadow Ln
- 4436 Wesley Trail
- 950 Radbourne Dr
- 796 Redford Ave
- 812 Breathitt Ave
- 904 Kyle Ave
- 4344 Brett Ln
- 757 Ivorton Rd S
- 1632 Marlboro Ave
- 1559 Obetz Ave
- 4356 Monterey Ct
- 1583 Metcalfe Ave
- 1247 Caravel Dr
- 1241 Caravel Dr
- 1271 Caravel Dr
- 4449 Catamaran Dr
- 4431 Catamaran Dr
- 1235 Caravel Dr
- 4461 Catamaran Dr
- 1254 Caravel Dr
- 1248 Caravel Dr
- 1221 Caravel Dr
- 1242 Caravel Dr
- 1266 Caravel Dr
- 1211 Caravel Dr
- 4467 Catamaran Dr
- 4395 Catamaran Dr
- 1236 Caravel Dr
- 1218 Caravel Dr
- 1229 Caravel Dr
- 1229 Caravel Dr Unit L-79
Your Personal Tour Guide
Ask me questions while you tour the home.