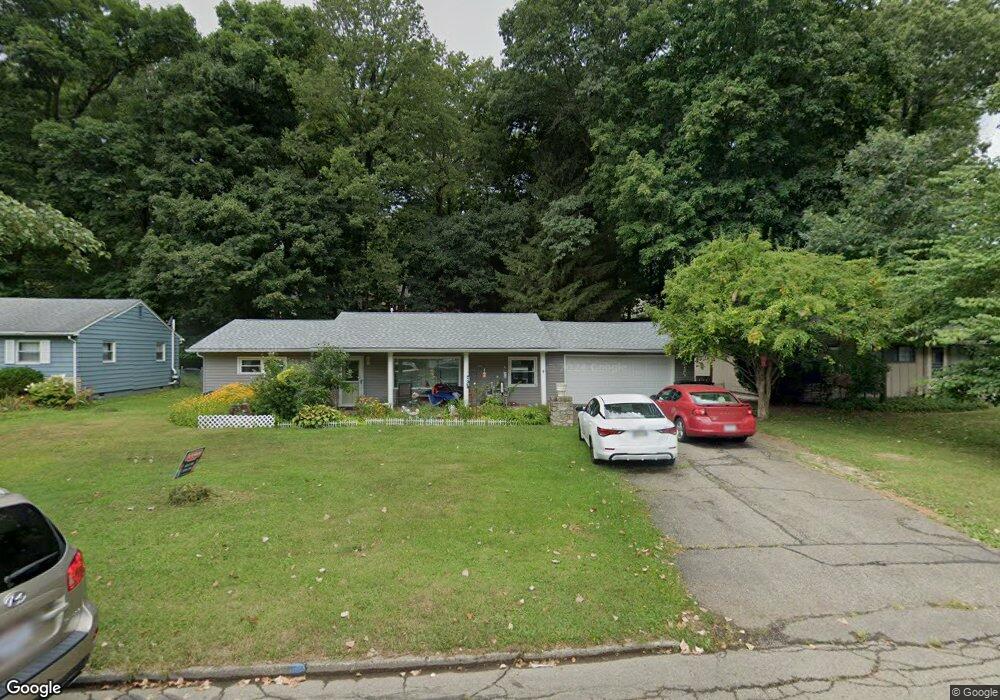
1253 E Allen St Lancaster, OH 43130
Estimated Value: $228,000 - $244,606
2
Beds
2
Baths
1,475
Sq Ft
$160/Sq Ft
Est. Value
About This Home
This home is located at 1253 E Allen St, Lancaster, OH 43130 and is currently estimated at $235,902, approximately $159 per square foot. 1253 E Allen St is a home located in Fairfield County with nearby schools including Medill Elementary School, Thomas Ewing Junior High School, and Lancaster High School.
Ownership History
Date
Name
Owned For
Owner Type
Purchase Details
Closed on
Dec 31, 2003
Sold by
Craft Richard C and Craft Carol R
Bought by
Lemay Cheri
Current Estimated Value
Home Financials for this Owner
Home Financials are based on the most recent Mortgage that was taken out on this home.
Original Mortgage
$106,000
Outstanding Balance
$49,710
Interest Rate
5.94%
Mortgage Type
Purchase Money Mortgage
Estimated Equity
$186,192
Purchase Details
Closed on
Dec 18, 2003
Sold by
Lemay Gary
Bought by
Lemay Cheri
Home Financials for this Owner
Home Financials are based on the most recent Mortgage that was taken out on this home.
Original Mortgage
$106,000
Outstanding Balance
$49,710
Interest Rate
5.94%
Mortgage Type
Purchase Money Mortgage
Estimated Equity
$186,192
Purchase Details
Closed on
Aug 23, 1999
Sold by
Craft Richard C
Bought by
Lemay Gary O and Lemay Cheri
Purchase Details
Closed on
Nov 23, 1993
Sold by
Craft Thelma G
Bought by
Craft Richard C
Create a Home Valuation Report for This Property
The Home Valuation Report is an in-depth analysis detailing your home's value as well as a comparison with similar homes in the area
Home Values in the Area
Average Home Value in this Area
Purchase History
| Date | Buyer | Sale Price | Title Company |
|---|---|---|---|
| Lemay Cheri | $95,700 | -- | |
| Lemay Cheri | -- | -- | |
| Lemay Gary O | $95,700 | -- | |
| Craft Richard C | $50,000 | -- |
Source: Public Records
Mortgage History
| Date | Status | Borrower | Loan Amount |
|---|---|---|---|
| Open | Lemay Cheri | $106,000 | |
| Closed | Lemay Gary O | $0 |
Source: Public Records
Tax History Compared to Growth
Tax History
| Year | Tax Paid | Tax Assessment Tax Assessment Total Assessment is a certain percentage of the fair market value that is determined by local assessors to be the total taxable value of land and additions on the property. | Land | Improvement |
|---|---|---|---|---|
| 2024 | $5,691 | $63,300 | $14,330 | $48,970 |
| 2023 | $2,302 | $63,300 | $14,330 | $48,970 |
| 2022 | $2,312 | $63,300 | $14,330 | $48,970 |
| 2021 | $1,848 | $47,400 | $11,940 | $35,460 |
| 2020 | $1,770 | $47,400 | $11,940 | $35,460 |
| 2019 | $1,683 | $47,400 | $11,940 | $35,460 |
| 2018 | $1,606 | $38,200 | $11,940 | $26,260 |
| 2017 | $1,607 | $42,970 | $11,940 | $31,030 |
| 2016 | $1,565 | $42,970 | $11,940 | $31,030 |
| 2015 | $1,562 | $41,620 | $11,940 | $29,680 |
| 2014 | $1,488 | $41,620 | $11,940 | $29,680 |
| 2013 | $1,488 | $41,620 | $11,940 | $29,680 |
Source: Public Records
Map
Nearby Homes
- 608 Sheridan Dr
- 1150 E Fair Ave
- 1159 E Fair Ave
- 1275 Wetsell Ave
- 831 Franklin Ave
- 1413 E Mulberry St
- 1020 Sycamore Dr
- 700 E Allen St
- 1066 Lanreco Blvd
- 134 Kanawha Rd
- 1522 Pleasantview Dr
- 1560 E Main St
- 726 King St
- 234 S Ewing St
- 1080 Sycamore Dr
- 105 Dogwood Ln
- 1570 E Main St Unit Lot 10
- 1106 E Walnut St
- 146 Hickory Ln
- 716 N Mount Pleasant Ave
- 1249 E Allen St
- 1265 E Allen St
- 1245 E Allen St
- 1230 Frederick St
- 1271 E Allen St
- 1224 Frederick St
- 1252 E Allen St
- 1241 E Allen St
- 1264 E Allen St
- 1236 Frederick St
- 1218 Frederick St
- 1242 Frederick St
- 1272 E Allen St
- 1235 E Allen St
- 1281 E Allen St
- 1244 E Allen St
- 1250 Frederick St
- 1280 E Allen St
- 1229 E Allen St
- 742 Sheridan Dr