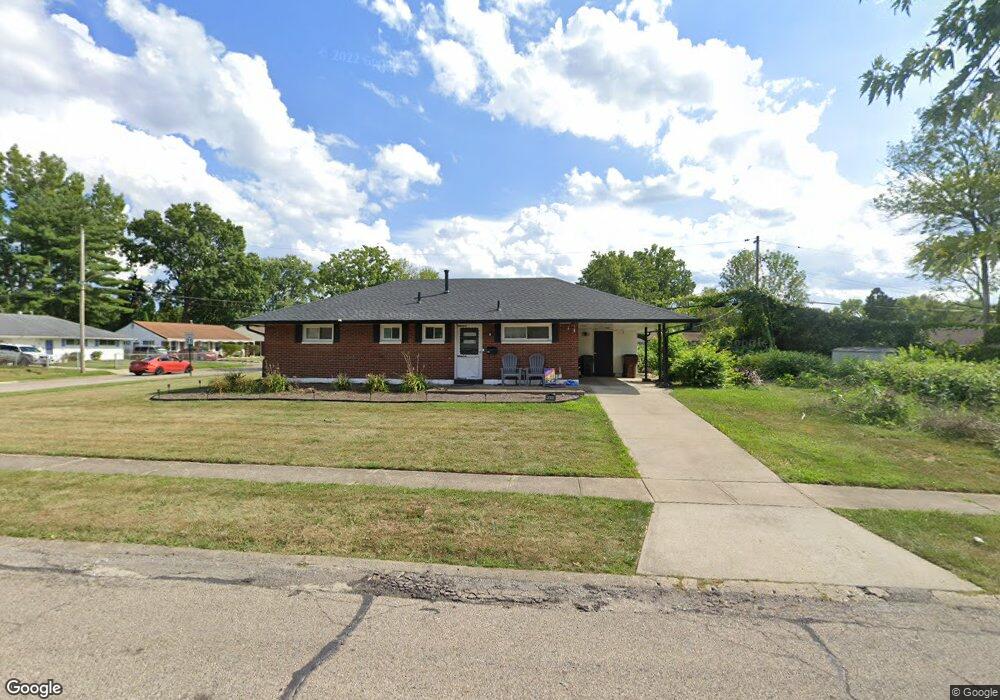
1253 Madeleine Cir Cincinnati, OH 45231
Finneytown NeighborhoodEstimated Value: $115,000 - $196,000
2
Beds
2
Baths
1,080
Sq Ft
$152/Sq Ft
Est. Value
About This Home
This home is located at 1253 Madeleine Cir, Cincinnati, OH 45231 and is currently estimated at $163,881, approximately $151 per square foot. 1253 Madeleine Cir is a home located in Hamilton County with nearby schools including Mt Healthy High School, John Paul II Catholic School, and St. Vivian School.
Ownership History
Date
Name
Owned For
Owner Type
Purchase Details
Closed on
Dec 23, 2010
Sold by
Patton Financial Real Estate Holdings Ll
Bought by
Sites Lyida M
Current Estimated Value
Home Financials for this Owner
Home Financials are based on the most recent Mortgage that was taken out on this home.
Original Mortgage
$53,605
Outstanding Balance
$35,810
Interest Rate
4.44%
Mortgage Type
FHA
Estimated Equity
$128,071
Purchase Details
Closed on
Aug 12, 2010
Sold by
Us Mortgage Investors I Llc
Bought by
Patton Financial Real Estate Holdings Ll
Purchase Details
Closed on
Feb 5, 2010
Sold by
Murphy Faye D and Smithson John E
Bought by
Us Mortgage Investors I Llc
Purchase Details
Closed on
Sep 28, 2004
Sold by
Estate Of Emma L Hilgeman
Bought by
Smithson John E and Murphy Faye D
Home Financials for this Owner
Home Financials are based on the most recent Mortgage that was taken out on this home.
Original Mortgage
$72,000
Interest Rate
6.75%
Mortgage Type
Fannie Mae Freddie Mac
Create a Home Valuation Report for This Property
The Home Valuation Report is an in-depth analysis detailing your home's value as well as a comparison with similar homes in the area
Home Values in the Area
Average Home Value in this Area
Purchase History
| Date | Buyer | Sale Price | Title Company |
|---|---|---|---|
| Sites Lyida M | $55,000 | Ltoc | |
| Patton Financial Real Estate Holdings Ll | $25,500 | None Available | |
| Us Mortgage Investors I Llc | $46,000 | Attorney | |
| Smithson John E | $72,000 | -- |
Source: Public Records
Mortgage History
| Date | Status | Borrower | Loan Amount |
|---|---|---|---|
| Open | Sites Lyida M | $53,605 | |
| Previous Owner | Smithson John E | $72,000 |
Source: Public Records
Tax History Compared to Growth
Tax History
| Year | Tax Paid | Tax Assessment Tax Assessment Total Assessment is a certain percentage of the fair market value that is determined by local assessors to be the total taxable value of land and additions on the property. | Land | Improvement |
|---|---|---|---|---|
| 2024 | $1,984 | $34,294 | $5,443 | $28,851 |
| 2023 | $1,885 | $34,294 | $5,443 | $28,851 |
| 2022 | $1,205 | $15,719 | $5,390 | $10,329 |
| 2021 | $1,173 | $15,719 | $5,390 | $10,329 |
| 2020 | $1,191 | $15,719 | $5,390 | $10,329 |
| 2019 | $1,179 | $14,553 | $4,991 | $9,562 |
| 2018 | $1,185 | $14,553 | $4,991 | $9,562 |
| 2017 | $1,125 | $14,553 | $4,991 | $9,562 |
| 2016 | $1,431 | $18,288 | $5,387 | $12,901 |
| 2015 | $1,442 | $18,288 | $5,387 | $12,901 |
| 2014 | $1,435 | $18,288 | $5,387 | $12,901 |
| 2013 | $1,478 | $19,250 | $5,670 | $13,580 |
Source: Public Records
Map
Nearby Homes
- 8840 Grenada Dr
- 8831 Daly Rd
- 8772 Balboa Dr
- 8950 Daly Rd
- 8734 Grenada Dr
- 8925 Monsanto Dr
- 1190 Sugartree Ct
- 8681 Desoto Dr
- 1151 Hempstead Dr
- 1277 Prospect Place
- 1100 Gracewind Ct
- 8627 Mockingbird Ln
- 8622 Mockingbird Ln
- 1458 Van Fleet Ave
- 8491 Daly Rd
- 1013 Vacationland Dr
- 1478 Foxwood Dr
- 7504 Elizabeth St
- 7508 Elizabeth St
- 1029 Bluejay Dr
- 8853 Cabot Dr
- 1259 Madeleine Cir
- 8847 Cabot Dr
- 1252 Madeleine Cir
- 1256 Madeleine Cir
- 1239 Madeleine Cir
- 8856 Cabot Dr
- 8841 Cabot Dr
- 8850 Cabot Dr
- 1238 Madeleine Cir
- 8877 Cabot Dr
- 1260 Madeleine Cir
- 8832 Grenada Dr
- 8844 Cabot Dr
- *** Cabot Dr
- 8876 Cabot Dr
- 8835 Cabot Dr
- 1267 Madeleine Cir
- 8879 Cabot Dr
- 1264 Madeleine Cir