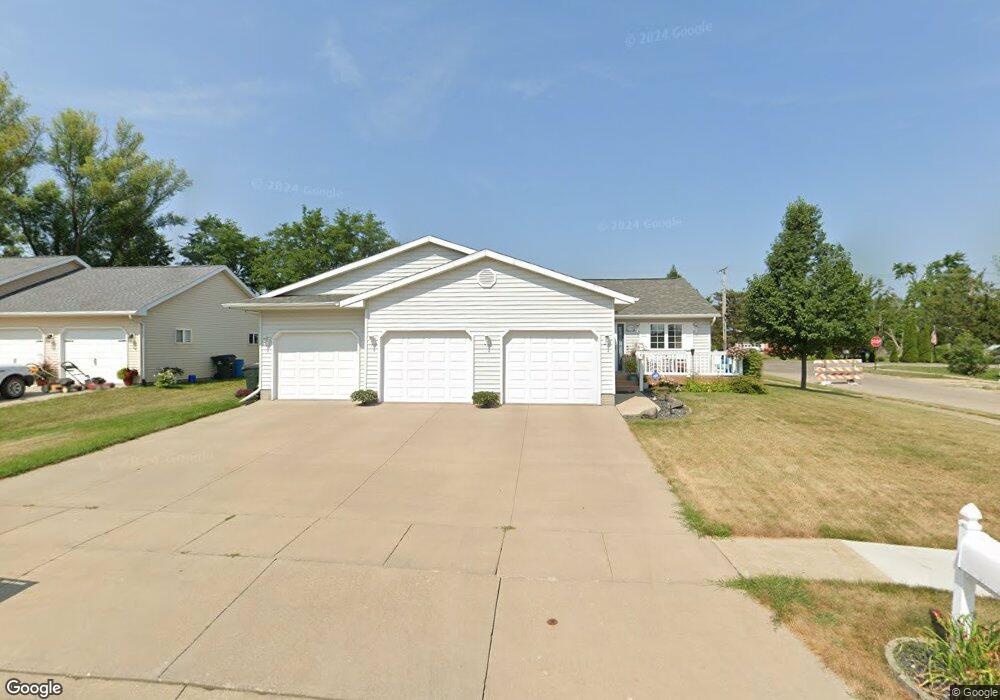
1254 41st Street Ct NW Cedar Rapids, IA 52405
Estimated Value: $312,000 - $333,000
4
Beds
3
Baths
1,664
Sq Ft
$194/Sq Ft
Est. Value
About This Home
This home is located at 1254 41st Street Ct NW, Cedar Rapids, IA 52405 and is currently estimated at $322,079, approximately $193 per square foot. 1254 41st Street Ct NW is a home located in Linn County with nearby schools including Maple Grove Elementary School, North Middletown Elementary School, and Ponderosa Elementary School.
Ownership History
Date
Name
Owned For
Owner Type
Purchase Details
Closed on
Jul 13, 2017
Sold by
Frederick Robert A and Frederick Susan K
Bought by
Christensen Phillip L and Christensen Mitzi M
Current Estimated Value
Purchase Details
Closed on
May 24, 2004
Sold by
Frederick Robert A and Frederick Susan K
Bought by
Christensen Phillip L and Christensen Mitzi M
Purchase Details
Closed on
Jul 9, 2002
Sold by
Fry Ivan T and Fry Patricia
Bought by
Frederick Robert and Frederick Susan
Home Financials for this Owner
Home Financials are based on the most recent Mortgage that was taken out on this home.
Original Mortgage
$158,396
Interest Rate
6.56%
Mortgage Type
Land Contract Argmt. Of Sale
Create a Home Valuation Report for This Property
The Home Valuation Report is an in-depth analysis detailing your home's value as well as a comparison with similar homes in the area
Home Values in the Area
Average Home Value in this Area
Purchase History
| Date | Buyer | Sale Price | Title Company |
|---|---|---|---|
| Christensen Phillip L | -- | None Available | |
| Christensen Phillip L | $160,000 | -- | |
| Frederick Robert | $158,500 | -- | |
| Christensen Phillip L | $158,461 | -- |
Source: Public Records
Mortgage History
| Date | Status | Borrower | Loan Amount |
|---|---|---|---|
| Previous Owner | Christensen Phillip L | $158,396 | |
| Closed | Christensen Phillip L | $0 |
Source: Public Records
Tax History Compared to Growth
Tax History
| Year | Tax Paid | Tax Assessment Tax Assessment Total Assessment is a certain percentage of the fair market value that is determined by local assessors to be the total taxable value of land and additions on the property. | Land | Improvement |
|---|---|---|---|---|
| 2025 | $5,022 | $326,200 | $65,600 | $260,600 |
| 2024 | $5,280 | $305,200 | $57,900 | $247,300 |
| 2023 | $5,280 | $294,300 | $57,900 | $236,400 |
| 2022 | $4,294 | $259,200 | $50,200 | $209,000 |
| 2021 | $4,434 | $216,200 | $46,300 | $169,900 |
| 2020 | $4,434 | $209,600 | $38,600 | $171,000 |
| 2019 | $3,906 | $209,600 | $38,600 | $171,000 |
| 2018 | $3,794 | $189,700 | $38,600 | $151,100 |
| 2017 | $3,659 | $188,300 | $38,600 | $149,700 |
| 2016 | $3,659 | $172,200 | $38,600 | $133,600 |
| 2015 | $3,600 | $169,187 | $38,583 | $130,604 |
| 2014 | $3,600 | $168,122 | $38,583 | $129,539 |
| 2013 | $3,500 | $168,122 | $38,583 | $129,539 |
Source: Public Records
Map
Nearby Homes
- 1608 Morris Ave NW
- 4819 Fruitwood Ln NW
- 3313 Crestwood Dr NW
- 3802 Richland Dr NW
- 3312 G Ave NW
- 1722 Gardner Dr NW
- 327* Edgewood Rd NW
- 3507 E Ave NW Unit F
- 3509 E Ave NW Unit D
- 1322 Woodside Dr NW
- 1613 Southview Dr NW
- 1410 Adair Ct SW Unit Lot 2
- 3600 Midway Dr NW
- 912 29th St NW
- 2825 Schultz Dr NW
- 327 NW Edgewood Rd Unit 324, 330, 336, 342 C
- 1733 Hillside Dr NW
- 4819 Ford Ave NW
- 2801 Schultz Dr NW
- 208 Lenora Dr NW
- 1242 41st Street Ct NW
- 1315 Wiley Blvd NW
- 1245 41st Street Ct NW
- 1230 41st Street Ct NW
- 4150 Jackson Dr NW
- 1230 Wiley Blvd NW
- 1224 Wiley Blvd NW
- 1233 41st Street Ct NW
- 4007 Jackson Dr NW
- 1220 Wiley Blvd NW
- 1211 Wiley Blvd NW
- 1310 Wiley Blvd NW
- 1214 Wiley Blvd NW
- 1264 40th Street Ct NW
- 1282 40th Street Ct NW
- 1246 40th Street Ct NW
- 1129 Wiley Blvd NW
- 4220 Cedarcrest Ct NW
- 1320 Wiley Blvd NW
- 1228 40th Street Ct NW